Bolstered by pandemic relief, economic security programs kept 53 million people above the poverty line in both 2020 and 2021, far surpassing the previous 2009 record of 40 million people protected from poverty. Public programs transformed what, without the programs, would have been a near-record surge in poverty in the COVID-19 recession into a record one-year overall poverty decline in 2020 and a record one-year decline in children’s poverty in 2021. The strong policy response brought the U.S. poverty rate in 2020 to its lowest level on record in data back to 1967, and then to a new record low of 7.8 percent in 2021, an analysis of Census and other historical data shows. Government aid helped prevent a sharp rise in poverty for all major racial and ethnic groups and narrowed differences in poverty rates between groups, yet wide inequities remain.
In 2021, the American Rescue Plan’s Child Tax Credit expansion and the third round of stimulus payments, in conjunction with other relief measures, spurred the largest one-year drop in child poverty on record, driving child poverty down to an all-time low of 5.2 percent. The Rescue Plan by itself lifted more people, including more children, above the poverty line with government assistance in a single year than any other piece of legislation enacted in more than 50 years. Children are particularly vulnerable to poverty’s long-term effects on health, education, and earnings.
The strong government response prevented the pandemic economy from adding further to the already disproportionate risk of poverty borne by Black and Latino individuals, including children. Government policies helped keep 30 percent of all Black children and as many as 24 percent of Latino children above the poverty line in 2021, as well as 10 percent of Asian and white children.
With the expiration of temporary pandemic assistance, poverty likely rose in 2022. The Census Bureau will release 2022 poverty data in September 2023.
These findings emerge from our analysis of the Census Bureau’s Current Population Survey (CPS) data and historical Supplemental Poverty Measure (SPM) data produced by Columbia University’s Center on Poverty and Social Policy.[1] We use the Census Bureau’s SPM data when available (for 2009 through 2021) and the Columbia SPM data for prior years. We create an “anchored” series by using the 2021 SPM poverty line adjusted for inflation.[2] Unlike the official poverty measure, the SPM counts income from non-cash programs such as the Supplemental Nutrition Assistance Program (SNAP, formerly known as the Food Stamp Program) and rental assistance, and from refundable tax credits for families with low or moderate incomes — the Earned Income Tax Credit (EITC) and Child Tax Credit — as well as cash benefits such as Social Security and unemployment insurance.
For many families these annual poverty figures likely obscure periods of turbulence and uncertainty within the year. In 2020, in particular, millions of jobless families spent weeks waiting for delayed unemployment insurance and other benefits, some households did not qualify for aid, and many of the benefits that Census figures count as received in 2020 arrived late in the year or not until the following year. But the net reduction in annual poverty during a time of deep economic crisis is remarkable, nonetheless.
Government policies played a historic role in reducing poverty in 2020 and 2021, building on a longer-term trend of government assistance becoming more effective at reducing poverty. The growing effectiveness of economic security programs helped bring down poverty rates over the last half-century.
Economic security programs lowered the number of people in poverty by just 1 percent in 1967. By 2019, that figure was 46 percent.[3] That is, in 2019, before accounting for government benefits, about 74 million people had pre-tax incomes below the poverty line. Counting benefits (including tax credits) and subtracting taxes lowers that number by 34 million people (or 46 percent). In 2020 and 2021, bolstered by pandemic relief, economic security programs reduced poverty by 64 percent and 67 percent respectively — all-time highs in poverty-reduction effectiveness with data back to 1967.
Changes in the Census Bureau’s survey methods make data after 2017 not strictly comparable to earlier years.[4] But the Census Bureau provides enough data about this survey transition to make clear that the anti-poverty effectiveness of economic security programs reached all-time highs in 2020 and 2021, and the SPM poverty rate reached record lows in 2020 and 2021 by our measure (the SPM with an inflation-adjusted poverty line).[5]
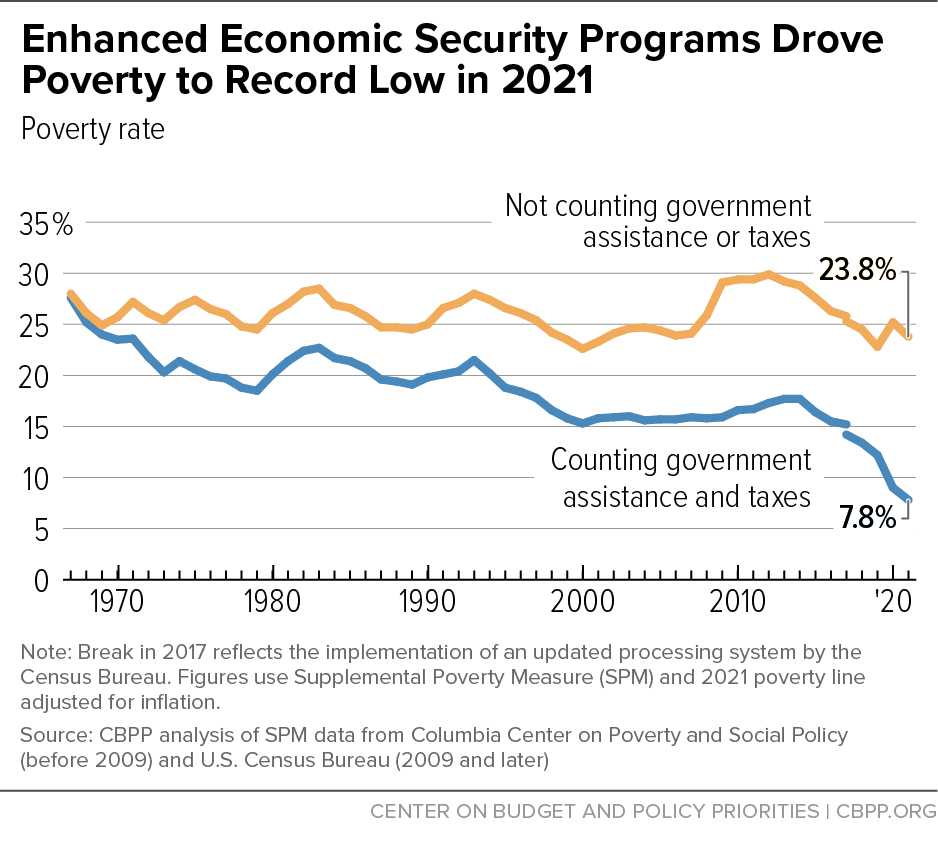
The SPM poverty rate in 2021 was 7.8 percent, a record low, and well below the rate of 12.2 percent in 2019 just before the pandemic and much lower than the 27.6 percent rate in 1967 by our measure. Not considering government assistance or taxes, poverty has improved only modestly over the past five decades, falling from 28.0 percent to 23.8 percent between 1967 and 2021. (See Figure 1.)
The impact of government poverty-reduction efforts has been just as striking among children, a particularly important success given child poverty’s long-lasting consequences and the health and economic benefits of reducing child poverty.[6]
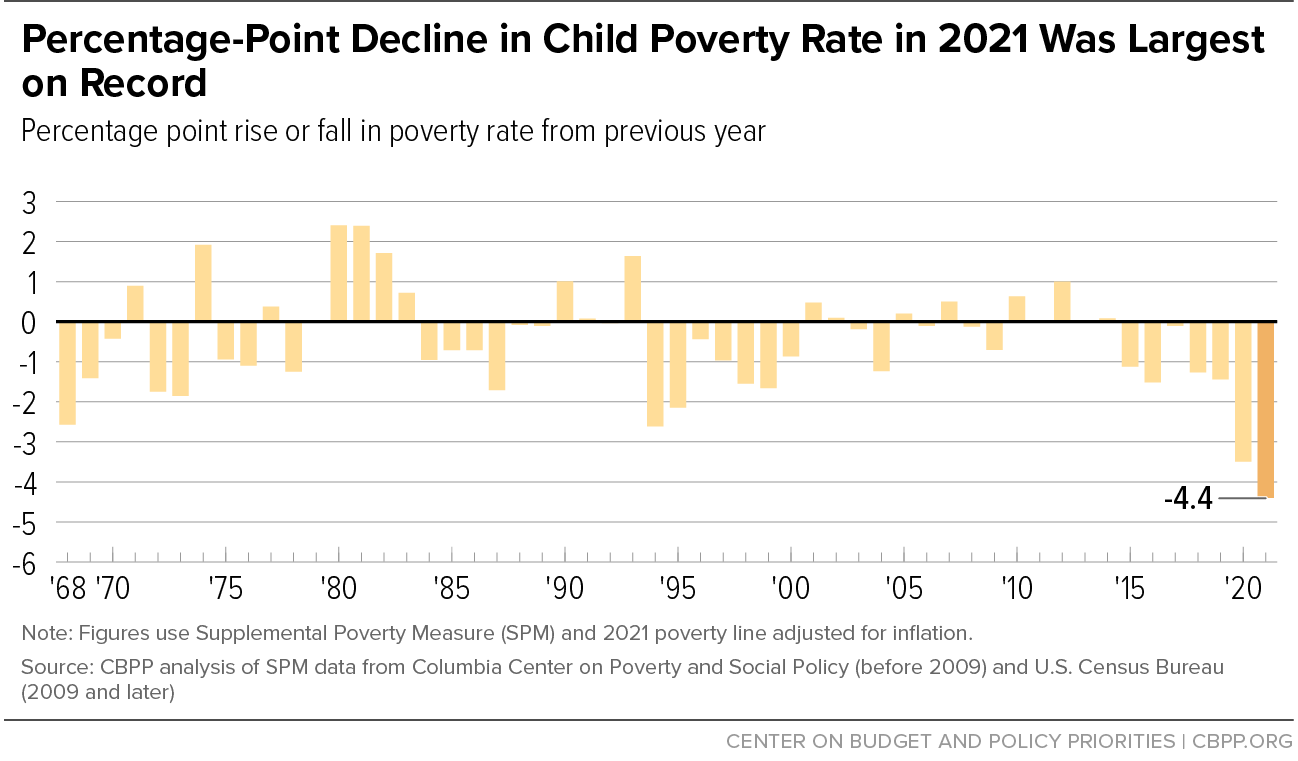
The one-year drop in child poverty in 2021 was the largest ever, in data back to 1967. (See Figure 2.) The year-over-year decline of 4.4 percentage points brought the child poverty rate in 2021 to an all-time low of 5.2 percent.
In 2019, government policies cut child poverty by 40 percent. Bolstered by pandemic relief legislation, economic security programs cut child poverty by 60 percent in 2020 and 76 percent in 2021, both all-time highs with data back to 1967. In the late 1960s, in contrast, counting government assistance and taxes made child poverty modestly higher because the federal tax code at the time taxed a substantial number of families with children into poverty (or deeper into poverty).
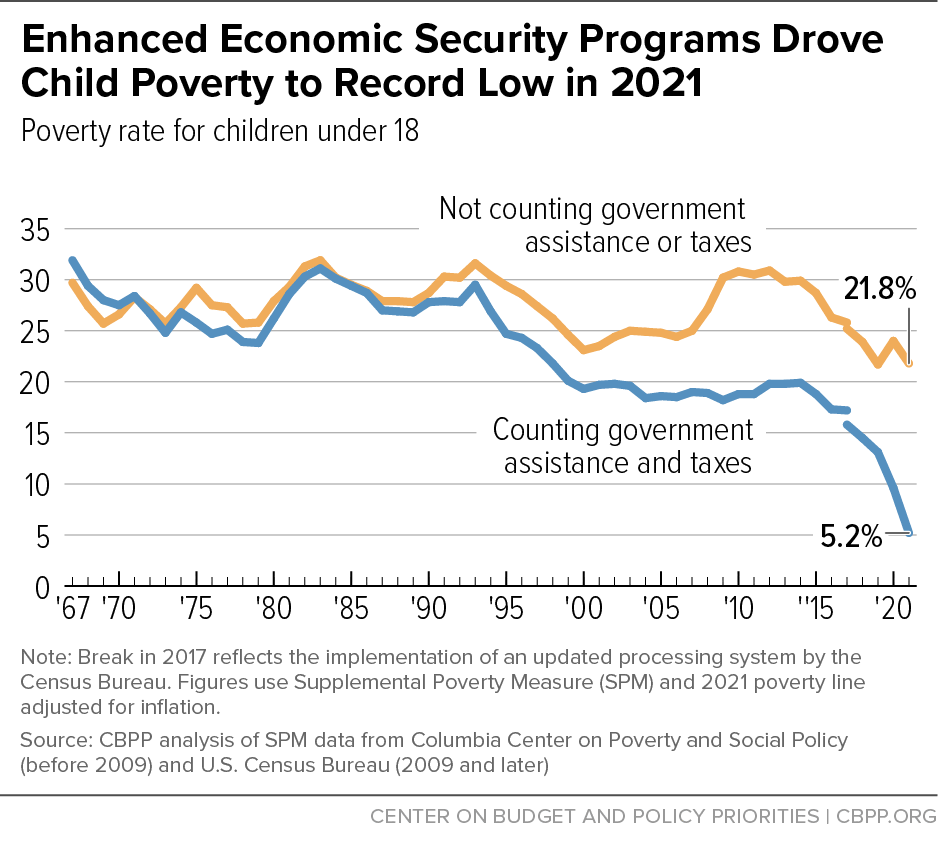
Since that time, federal policymakers have established and expanded the EITC and the Child Tax Credit. Nationwide implementation of SNAP in the 1970s and its increased effectiveness in reaching more eligible people in more recent decades have lifted millions of additional children out of poverty as compared to the late 1960s.[7] In 2021, counting government assistance and taxes drops the child poverty rate from 21.8 percent to 5.2 percent. (See Figure 3.)
By lowering poverty, economic security programs can make a lasting difference, particularly for children. A congressionally chartered report from the National Academy of Sciences noted the difference that anti-poverty programs can make: “The weight of the causal evidence indicates that income poverty itself causes negative child outcomes . . . . Many programs that alleviate poverty either directly, by providing income transfers, or indirectly, by providing food, housing, or medical care, have been shown to improve child well-being.”[8]
Recent studies of nutrition assistance and the Earned Income Tax Credit, for example, have found evidence that assistance early in childhood leads to children earning more as young adults.[9] Other studies have linked various income assistance programs such as food assistance and housing subsidies with healthier birthweights, lower stress for mothers (measured by reduced stress hormone levels in the women’s bloodstream), better nutrition in childhood, higher scores on reading and math tests and other measures of school performance, more high school completion, higher rates of college entry, and better health in adulthood.[10]
The historic poverty reduction in 2020 and 2021 was driven by four major legislative packages enacted in 2020 and 2021 that provided stimulus payments, expanded unemployment insurance, increased nutrition and housing assistance, improved tax credits, and made health coverage more accessible.
In both 2020 and 2021, economic security programs bolstered by economic recovery legislation lowered the number of people in poverty by 53 million, far exceeding the prior record of 40 million set in 2009. The percentage-point reduction in the poverty rate due to government assistance net of taxes (16.2 percentage points in 2020 and 16.0 percentage points in 2021) likewise exceeded the previous record (13.2 percent in 2009).
The three policies that reduced poverty the most as measured by the Supplemental Poverty Measure were stimulus payments (formally known as Economic Impact Payments), expansions in unemployment insurance, and the expansion of the Child Tax Credit. All three of these policies were temporary and were no longer in effect by 2022.
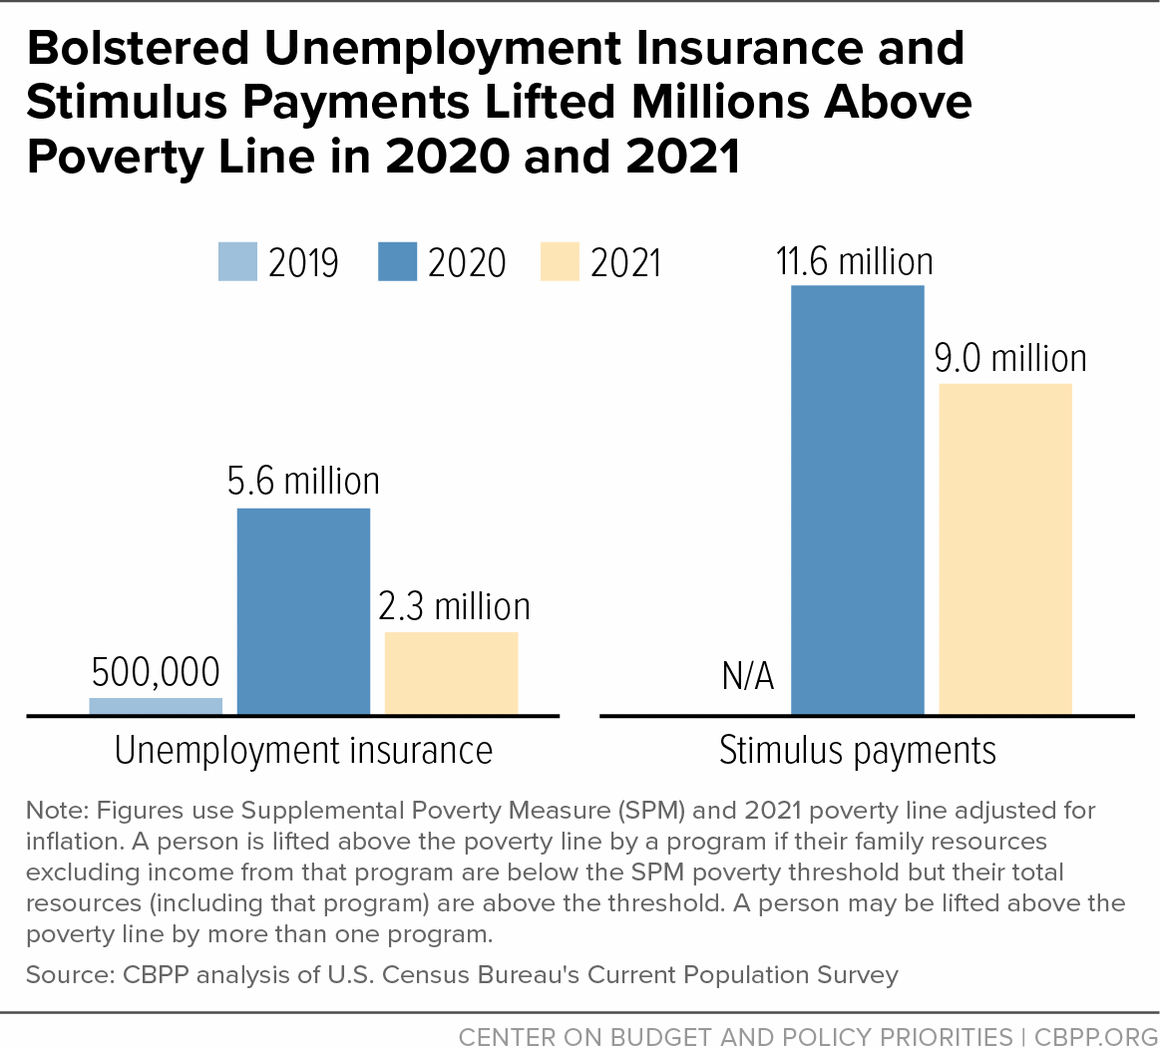
Stimulus payments kept the annual incomes of 11.6 million people in 2020 and 9.0 million people in 2021 above the poverty line. Unemployment insurance benefits kept 5.6 million people out of poverty in 2020 and 2.3 million in 2021. (This compares to 0.5 million in 2019.) (See Figure 4.)
The temporary pandemic unemployment programs significantly increased the coverage, duration, and adequacy of unemployment benefits compared to regular unemployment insurance, substantially reducing hardship and providing important stabilization and impetus for recovery for a sharply declining economy.[11] These steps were taken because the permanent unemployment insurance system does not cover many unemployed workers and often provides inadequate benefits.
The full poverty-reducing effect of unemployment insurance is likely even higher than the above figures suggest, moreover, because the survey data do not capture a substantial amount of unemployment benefits. According to one estimate, unemployment benefits’ effect on poverty in the pandemic was twice as high when one corrects for this underreporting.[12] (See methodological appendix for more discussion of underreported income.)
The effectiveness of stimulus payments in reducing poverty partly reflected design and implementation improvements compared to similar stimulus payments in 2008, during the Great Recession.[13] In the earlier crisis, payments went only to individuals who had filed tax returns, and only individuals with sufficient tax liability received the full amount. The 2020 and 2021 stimulus payments were the first time the IRS provided direct cash payments to households with no minimum earnings threshold or tax filing requirement, so people with the lowest incomes were eligible for the full rebate amount.
And, unlike in 2008, the Treasury Department was able to deliver benefits automatically to recipients of Social Security, Supplemental Security Income, railroad retirement, and certain veterans’ benefits, rather than forcing them to file tax returns that were otherwise unnecessary. The IRS created simpler portals for filing for the payments for those who don’t usually file a tax return, boosting participation, though significant numbers of people who were eligible for payments still missed out because they didn’t apply for them.
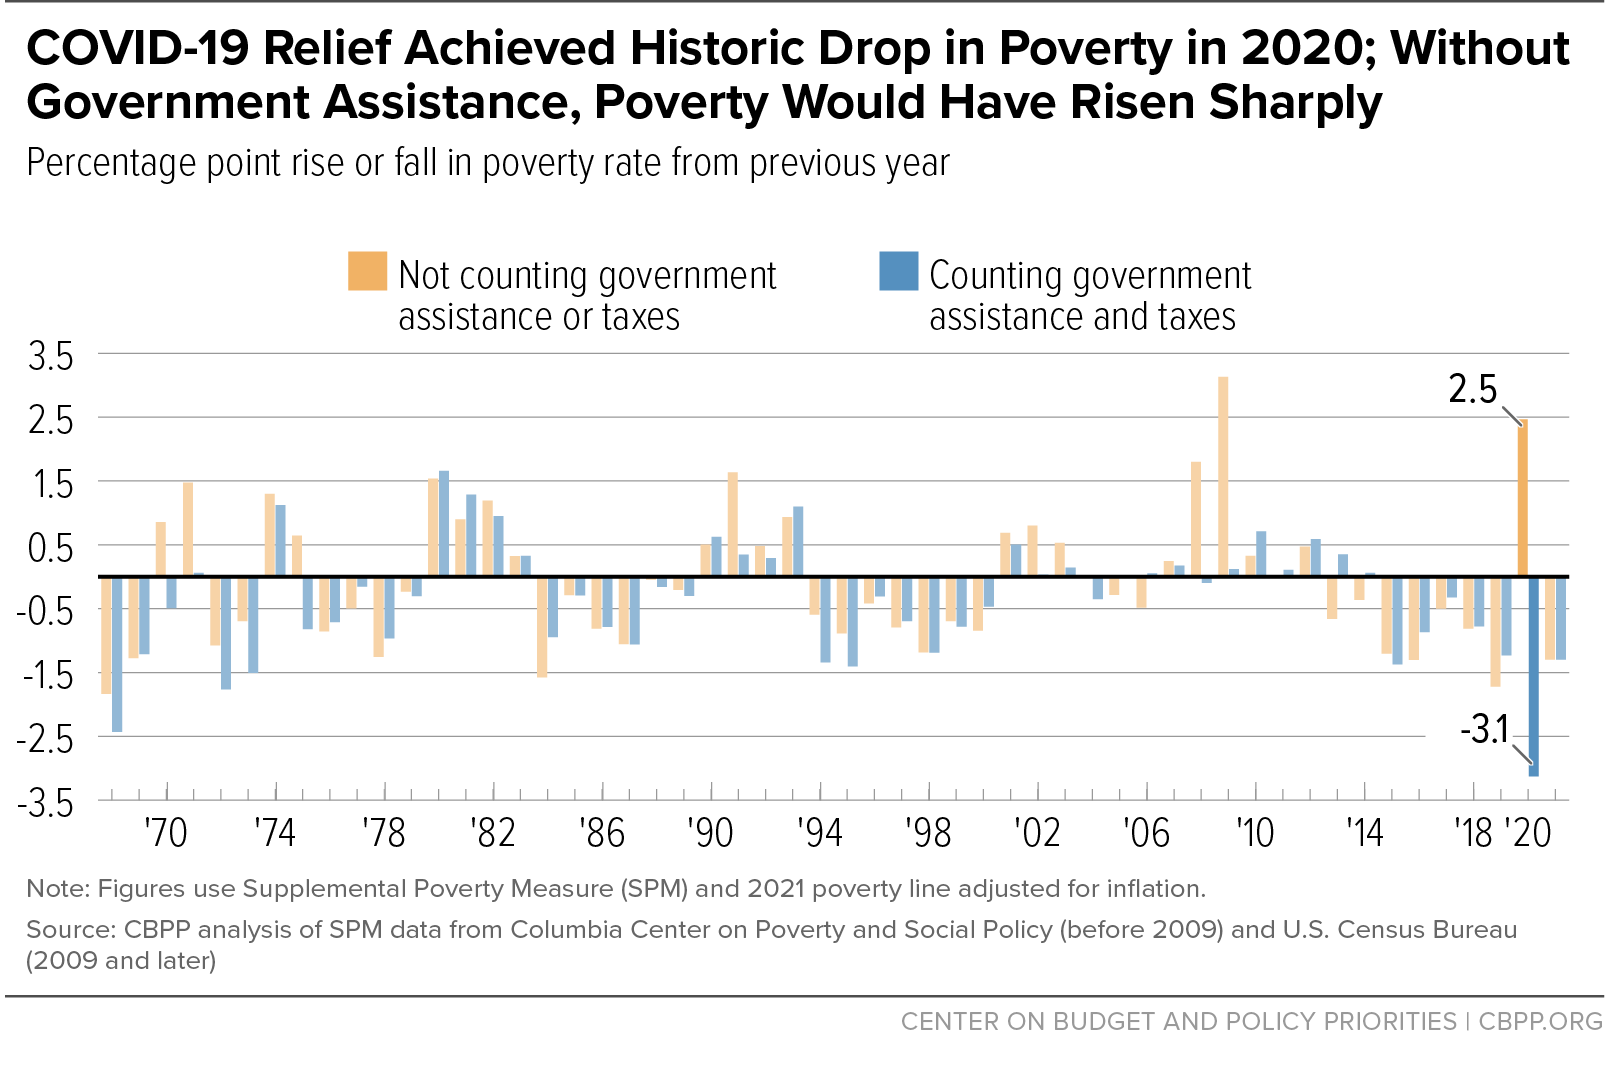
Government assistance in 2020 turned what would have been a near-record surge in poverty that year into a record one-year poverty decline. Not considering government assistance or taxes, the share of people in poverty would have risen in 2020 by the second-largest amount on record: 2.5 percentage points (8 million people). But when government assistance and tax policies are included, the share of people with annual income below the poverty line fell in 2020 by 3.1 percentage points (10 million people), the largest amount on record in data back to 1967. (See Figure 5.) (Poverty fell again in 2021 to a new record low, as described below.)
In 2019, 34 million fewer people had incomes below the poverty line when government assistance and taxes are considered (40 million compared with 74 million when they are not counted). In 2020, counting government assistance and taxes lowered the number of people in poverty by 53 million (from 82.3 million to 29.5 million).
Much of that poverty reduction came from the Coronavirus Aid, Relief, and Economic Security (CARES) Act, which included the first round of stimulus payments and a sizable expansion of unemployment benefits. These benefits lifted more people above the poverty line with government assistance — approximately 11 million people — than any other piece of legislation enacted since at least 1967, when our SPM poverty data begin.[14]
Other legislation in 2020 — including temporary SNAP expansions enacted in March and a second round of stimulus payments enacted in December — brought annual income above the poverty line for several million additional people in that year.
The following year, the American Rescue Plan lifted even more people — approximately 16 million — above the poverty line through its stimulus payments and temporary expansions of the Child Tax Credit, unemployment insurance, and the Earned Income Tax Credit.[15]
The Rescue Plan was particularly important for children. Two provisions of the law alone — the Child Tax Credit expansion and the third pandemic stimulus payment (which, unlike the CARES stimulus payment was as large for children as for adults) — lifted far more children above the poverty line with government assistance in a single year — more than 5 million children — than any other piece of legislation on record in data back to at least 1967.[16]
Bolstered by the Rescue Plan, economic security programs overall (including long-standing programs) lifted 12.2 million children above the poverty line in 2021, also an all-time high. (The previous records were 10.7 million children in 2020, and before that, 9.0 million children in 2009.) The child poverty rate in 2021 was 16.7 percentage points lower when counting government assistance and taxes than not counting them, also a record reduction. (The previous records were 14.4 percentage points in 2020 and 12.0 percentage points in 2009.)
The Rescue Plan’s one-year Child Tax Credit expansion played a central role in these reductions. It raised the maximum credit amount from $2,000 to $3,600 for children under 6 and $3,000 for children aged 6-17 (the first time 17-year-olds were included). Most importantly, for the first time it made the Child Tax Credit “fully refundable,” meaning the full credit was available to children in families with low or no earnings. When the expansion expired at the end of 2021, the credit reverted to the flawed design left in place by the 2017 Trump tax law. As a result, an estimated 19 million children — or more than 1 in 4 children under age 17 — will get less than the full Child Tax Credit or no credit at all this year because their families earn too little, while families with much higher incomes (up to $400,000 for married couples) will receive the full $2,000 credit for each child.[17]
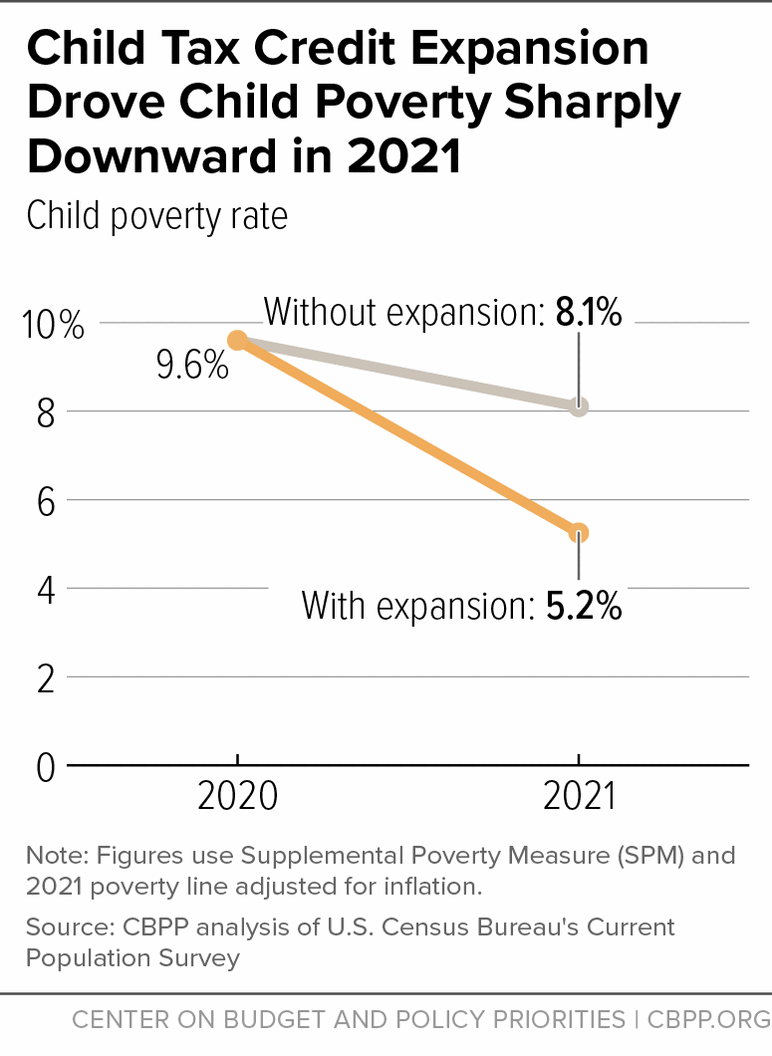
Without the American Rescue Plan’s Child Tax Credit expansion (but with the stimulus payments and other relief measures in place), the child poverty rate would have dropped from 9.6 percent in 2020 to 8.1 percent in 2021. With the Child Tax Credit expansion also in place, the rate fell to 5.2 percent. (See Figure 6.)[18]
Without the Child Tax Credit expansion, some 2.1 million more children would have been in poverty in 2021, based on Census estimates of families’ taxes.[19]
The Rescue Plan for the first time delivered up to half of the Child Tax Credit as advance monthly payments from July to December 2021 rather than all at tax time. Note that Census’ poverty calculations count the entire Child Tax Credit as 2021 income, following Census’ long-standing practice of counting tax-based benefits in the relevant tax year. In reality, most families received half of the credit in early 2022 when they filed their 2021 taxes.
Other relief measures, such as expansions in SNAP benefits, assistance for those at risk of eviction, and expansions of the EITC, helped further reduce poverty and hardship.
Relief measures that provided uninterrupted health insurance coverage for Medicaid enrollees and lowered or eliminated premiums for Affordable Care Act (ACA) marketplace enrollees boosted health coverage. These health coverage measures helped to keep the uninsured rate from rising in 2020 and 2021, which is highly unusual during a major economic downturn. In fact, according to the Census Bureau’s American Community Survey, the uninsured rate fell to 8.6 percent in 2021, to match 2016’s record low. Administrative data show that Medicaid enrollment rose by over 15 million people between February 2020 and December 2021, while ACA marketplace enrollment also reached a record high.[20] The federal response to the pandemic also included increased support for child care, paid leave, and fiscal aid to states, cities, counties, and tribal governments.[21]
Annual poverty figures for 2020 put the best face on a turbulent year. The annual figures average together periods when families received substantial relief — including stimulus payments and boosts to jobless benefits, food assistance, and more — with periods when their incomes were down, obscuring the weeks and months of hardship when families were waiting for aid to arrive or wondering if Congress would renew expiring benefits or pass additional stimulus payments.
Moreover, more than $163 billion in the second round of stimulus payments wasn’t enacted until December 27, 2020,[22] yet most of these dollars are counted in Census’ 2020 annual income data because, as noted above, Census counts tax credits (including the stimulus payments, which were delivered through the tax system) based on the tax year for which they are received, not the year in which they were paid.
Even if Census had counted this income in 2021 rather than 2020, however, the SPM poverty rate would still have declined in 2020 by the largest amount since 1968 and reached its lowest level since 1967, we estimate. Despite delays and other issues that arose as new relief measures were implemented, poverty in both 2020 and 2021 would have been vastly worse without the unprecedented relief.
Black and Latino people entered the pandemic with lower income and fewer assets due to discrimination and other structural barriers to opportunity. This meant that many elements of the pandemic response that targeted those with the greatest need had particularly large, positive impacts on Black and Latino people.[23]
Not counting government assistance, poverty would have risen by 2.6 percentage points for Black, 2.2 percentage points for Latino, 3.8 percentage points for Asian, and 2.3 percentage points for white individuals between 2019 and 2020. Once that assistance is counted, poverty fell by 4.8 percentage points for Black, 5.7 percentage points for Latino, 3.1 percentage points for Asian, and 2.0 percentage points for white individuals.[24]
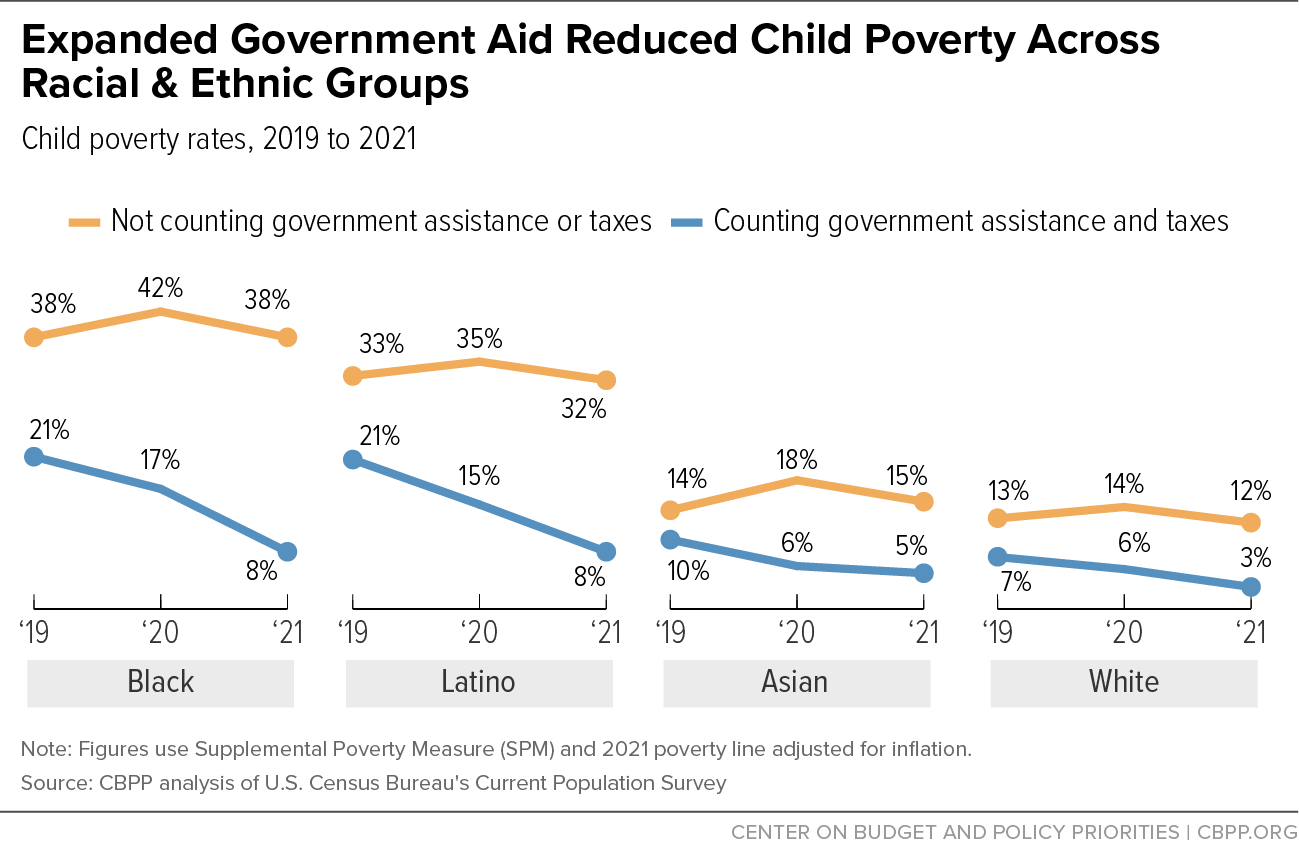
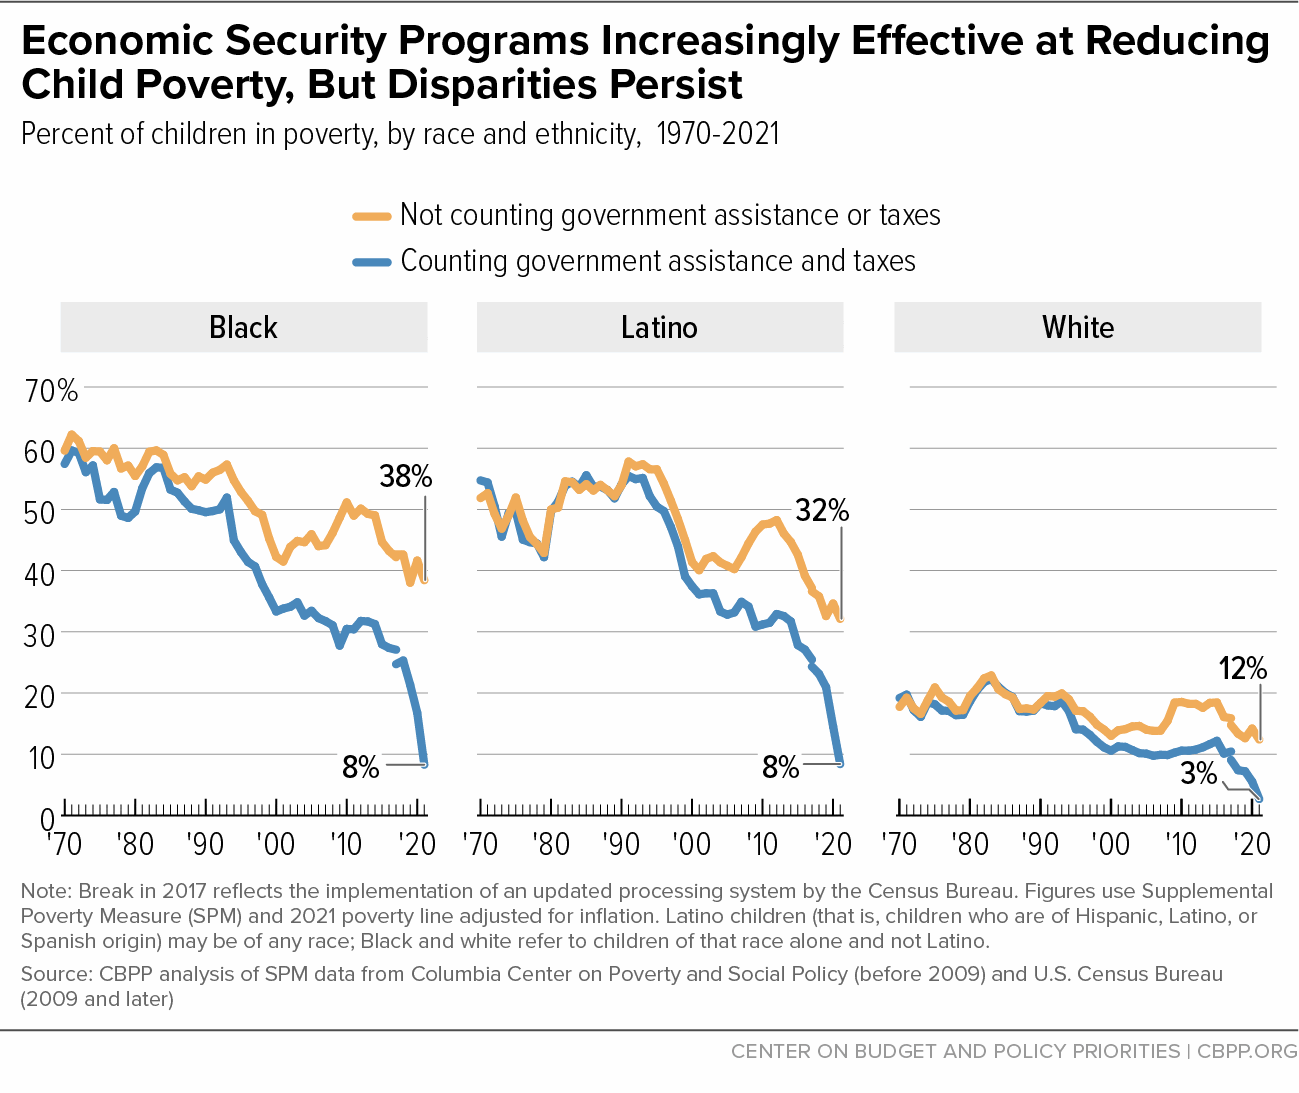
Economic security programs are particularly important in reducing racial inequities in child poverty. Expanded government assistance prevented a sharp rise in child poverty across racial and ethnic groups in 2020 and drove down child poverty rates in 2021. (See Figure 7.) Government assistance and taxes helped keep 30 percent of all Black children and as many as 24 percent of Latino children above the poverty line in 2021, as well as 10 percent of Asian and white children, though poverty after accounting for government programs remains three times higher among Black and Latino children than white children.
Economic security programs reduced differences in child poverty rates by race and ethnicity by over half in 2020 and by over two-thirds in 2021. Before counting government assistance and taxes, the poverty rate for Black children in 2021 was 26 percentage points higher than for white children. For Latino children, it was 20 percentage points higher. Once government assistance and taxes are accounted for, the poverty rate for Black children was 5 percentage points higher than for white children. For Latino children, it was 6 percentage points higher.
These differences were the narrowest they’ve ever been, with data back to 1967. Prior to the pandemic, the poverty rates for both Black and Latino children were always at least 13 percentage points above the corresponding rates for white children and, since 1967, averaged about 28 percentage points higher.
The Rescue Plan’s one-year Child Tax Credit expansion in 2021 played a key role in this historic narrowing of racial and ethnic differences in child poverty. Making the full Child Tax Credit available to children in families with low incomes lowered child poverty among all races and ethnicities, and especially helped Black, Latino, and American Indian or Alaska Native (AIAN) children, whose families are overrepresented in low-paid work due to past and present hiring discrimination, inequities in housing opportunities, access to good schools, and other sources of inequality.
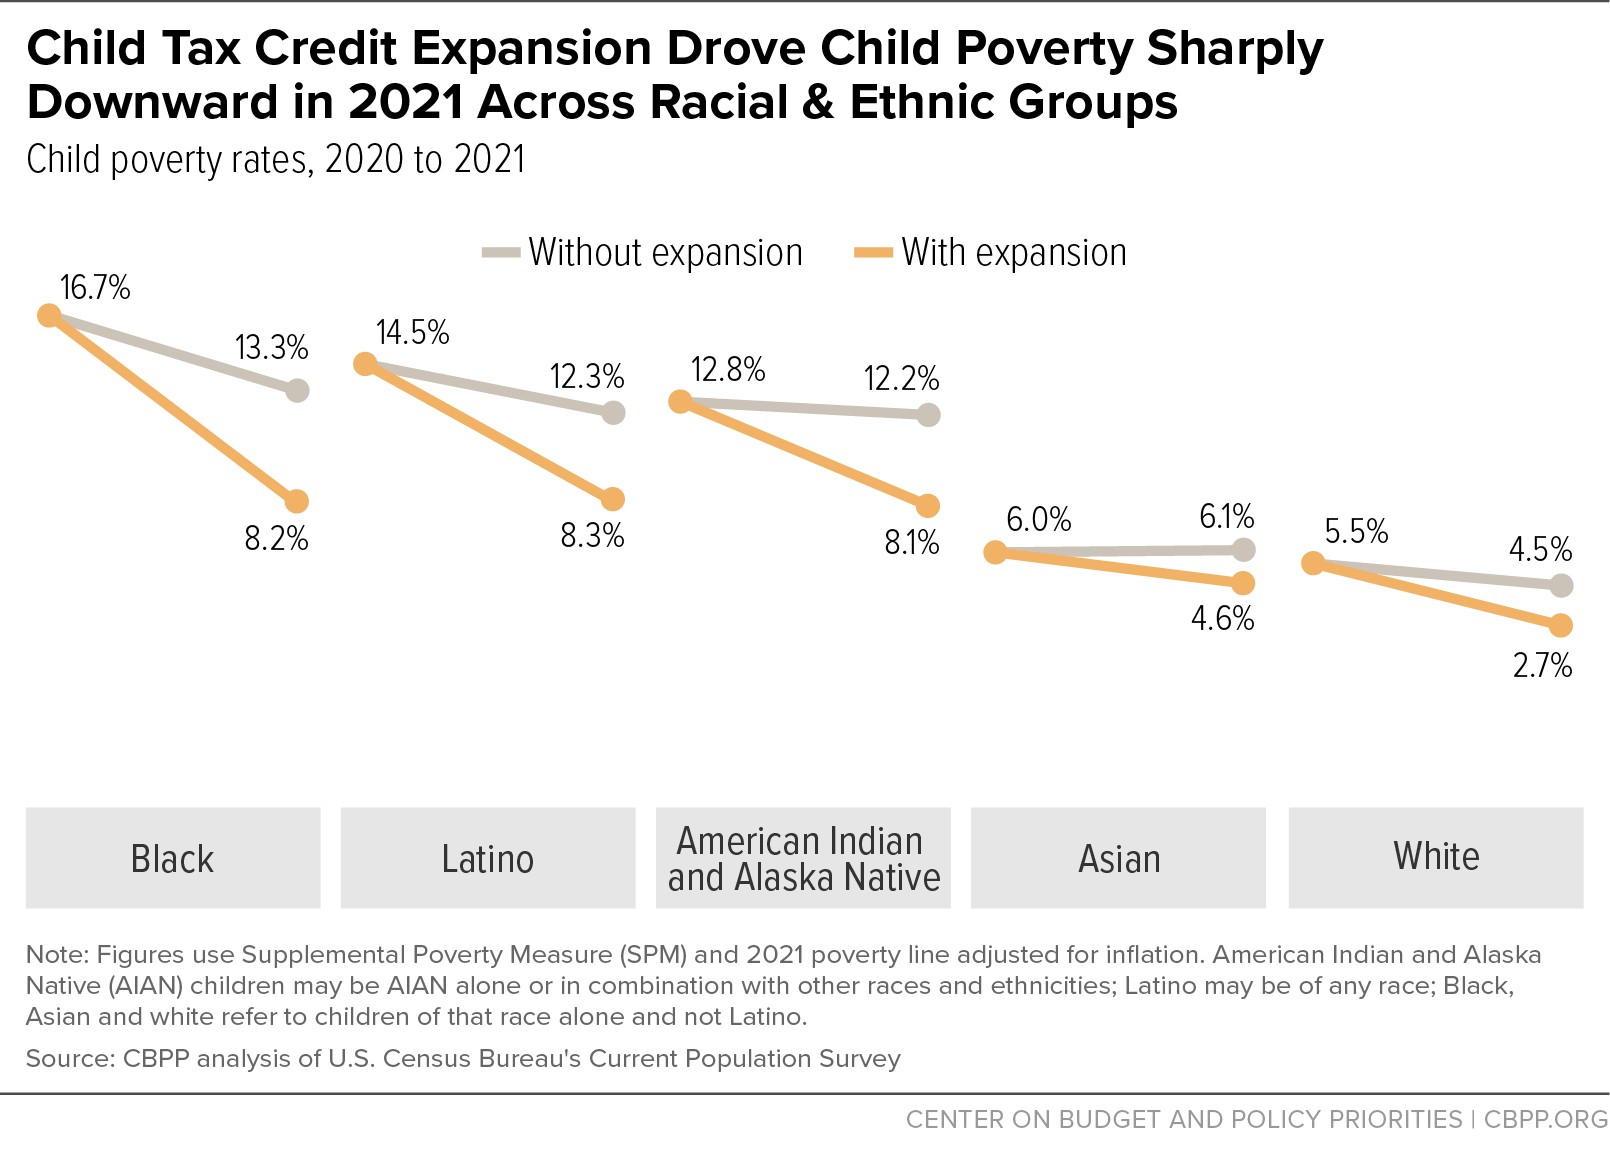
By lifting larger shares of Black, Latino, and AIAN children above the poverty line, the expansion narrowed differences in child poverty rates by race and ethnicity. The Child Tax Credit expansion helped keep 5.1 percent of all Black children, 4.1 percent of AIAN children, and as many as 4.0 percent of Latino children above the poverty line in 2021, as well as 1.8 percent of white and 1.5 percent of Asian children.[25] (See Figure 8.)
After 2021, Congress allowed the Child Tax Credit to return to an earlier, smaller, and less equitable design that denies full participation in the credit to families with low or no earnings. Because children in families with low incomes currently cannot receive the full Child Tax Credit, roughly 46 percent of Black children, 39 percent of AIAN children, 37 percent of Latino children, 17 percent of white children, and 15 percent of Asian children get less than the full credit or no credit at all.[26]
Making the credit more available to these children would lower their poverty, push back against long-standing inequities, and ensure all families can offer their children a stronger foundation of income security and opportunity in difficult times.
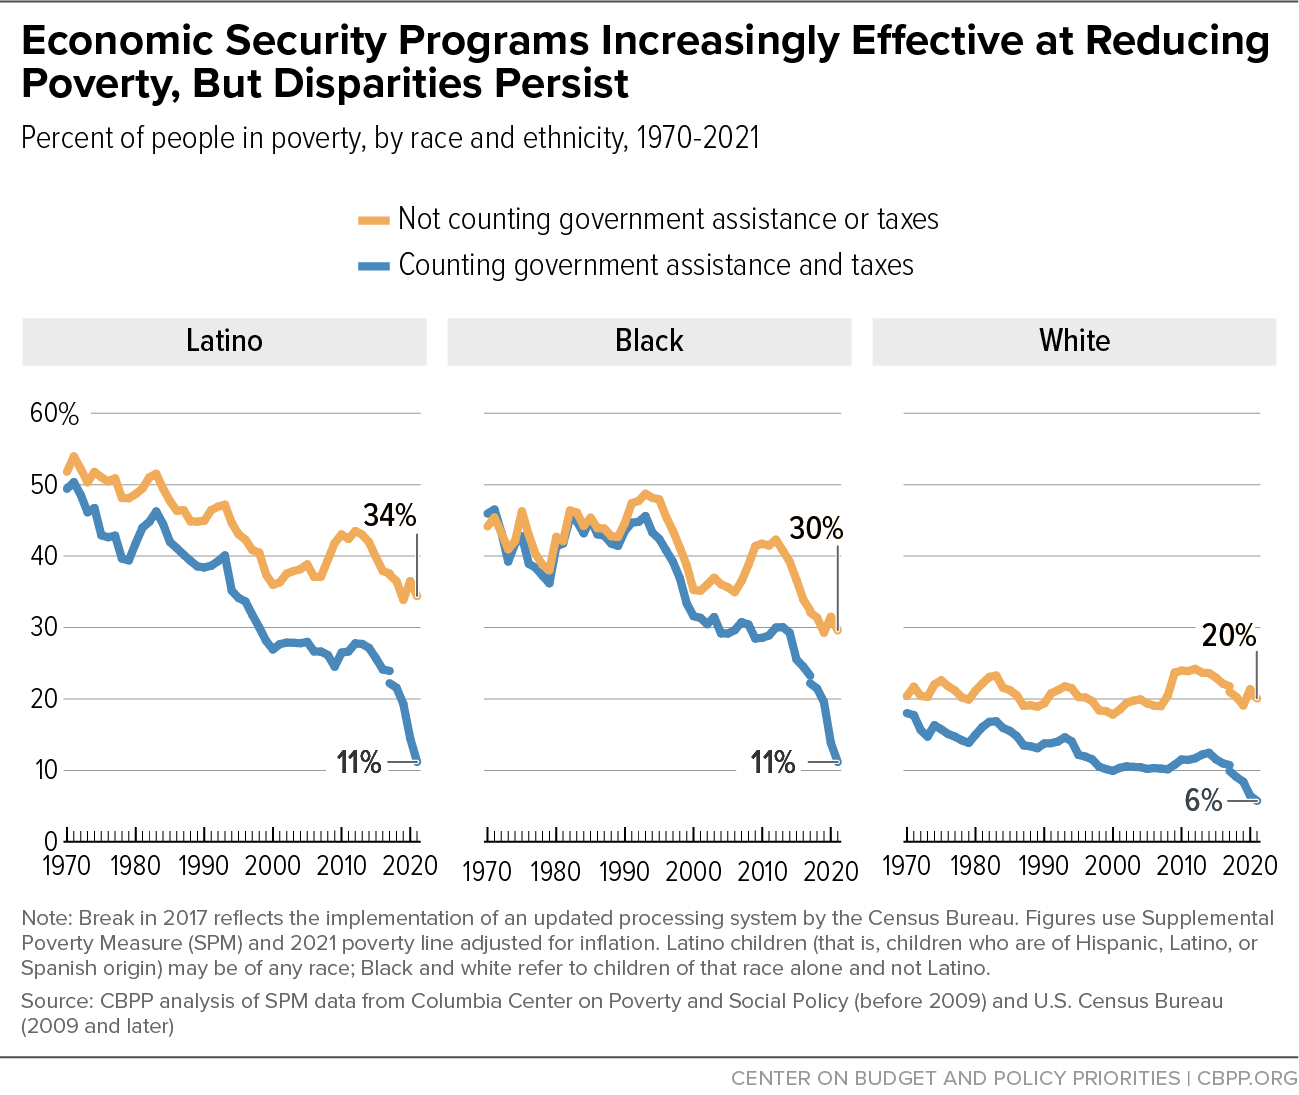
Over the last half-century, economic security programs such as Social Security, food assistance, tax credits, and housing assistance have reduced poverty for millions of people and reduced inequities in poverty by race and ethnicity. At the same time, barriers to opportunity, including discrimination and other obstacles to employment, education, and health care, remain large and keep poverty rates much higher for some racial and ethnic groups than others.[27]
Between 1970 and 2019 the poverty rate fell for all groups, but it fell even more for Black and Latino people: by 30 and 26 percentage points, respectively, compared with 10 percentage points for white non-Latino people, we calculate. Even with this reduction, poverty rates for Black and Latino people remained far above the white poverty rate. Our analysis by race and ethnicity begins in 1970, the first year that data on Latino ethnicity are available.[28]
Economic security programs have become more effective at reducing poverty and narrowing the differences in poverty rates across racial and ethnic groups over the last five decades. In 1970, families’ government benefits and the taxes they paid lowered the white poverty rate and the Black poverty rate by 2 percentage points and increased the Latino poverty rate by 2 percentage points. In contrast, in 2019, before the pandemic, accounting for government benefits and taxes lowered the white poverty rate by 11 percentage points, Black poverty by 15 percentage points, and Latino poverty by 10 percentage points.
In 2021, economic security programs, enhanced by COVID relief legislation, lowered the white poverty rate by 14 percentage points, Black poverty by 23 percentage points, and Latino poverty by 18 percentage points. (See Figure 9.)
For children, government programs played an even larger role in lowering poverty and narrowing racial and ethnic inequities. Between 1970 and 2019, the Black child poverty rate fell by 36 percentage points, the Latino child poverty rate by 34 percentage points, and the white child poverty rate by 12 percentage points, though the white child poverty rate remained far lower than the poverty rate for Black and Latino children. More than half of the declines in Black, Latino, and white child poverty were driven by the increasing effectiveness of government assistance at lifting families’ incomes above the poverty line. (See Figure 10.)
COVID relief measures accelerated this progress in 2020 and even more so in 2021. For example, for Black children, the poverty rate fell to 8.2 percent in 2021 from 16.7 percent in 2020 and 21.3 percent in 2019. This is stunning progress — in 2019 more than 1 in 5 Black children lived in families with incomes below the poverty line. In 2021, fewer than 1 in 10 did.
Despite this progress, past and present discrimination in both the private sector and public policies kept overall poverty rates in 2021 nearly twice as high among Black and Latino people (both 11.2 percent) than among white people (5.7 percent). Child poverty reflected the same dynamic, with Black and Latino child poverty rates at 8.2 and 8.3 percent, respectively, compared to 2.7 percent among white children.
Large-scale, emergency action in the pandemic was remarkably successful at protecting households from serious hardship, but difficult delays and gaps in aid were common, in part because our underlying economic security programs do too little even in normal economic times to help support families, children, and workers who struggle to afford the basics. Many jobless individuals waited weeks for unemployment insurance due to slow and outdated unemployment insurance benefit systems. Others weren’t covered by stimulus payments or other assistance because of their own or a family member’s immigration status, or for other reasons. For example, early stimulus payments omitted dependents aged 17 and older. Some short-term indicators of economic strain or uncertainty such as food pantry utilization increased.[29]
Many of these problems could have been averted if stronger economic security policies had been in place before the pandemic. For example, making permanent reforms to the unemployment insurance system would better support workers in the next recession.[30]
The expiration of these emergency actions since 2021 almost certainly raised poverty in 2022 when measured using the Supplemental Poverty Measure. The Census Bureau will release 2022 poverty data in September 2023. The end of stimulus payments, the EITC and Child Tax Credit expansions, and expanded unemployment benefits almost certainly outweighed the still important job growth and wage gains for lower-paid workers that helped boost incomes in 2022. To recapture and build on the progress against poverty made during the pandemic, policymakers will need to strengthen economic supports for families who face difficulties affording the basics.
Despite tremendous progress in reducing poverty and advancing equity over the last 50 years, large gaps in U.S. anti-poverty policies have continued to leave U.S. children more exposed to poverty than other nations’ children. Before the pandemic, 20 percent of U.S. children lived in families with incomes below half of the national median, the poverty measure most commonly used for international comparisons. This is a much higher share than in any of the world’s 18 other similarly wealthy nations, where between 3 and 15 percent of children are poor.[31] Poverty in the United States also stands out when using an absolute poverty measure to compare nations.[32]
The sheer number of U.S. families who sometimes struggle to meet basic needs is not well understood because data on such hardships seldom span more than a year of a family’s life. Many more families face hardship — that is, an inability to afford basic needs — and poverty at some point over multiple years than in a single year.
CBPP analysis of data from the Census Bureau’s Survey of Income and Program Participation (SIPP), newly redesigned to allow tracking of people’s hardships over multiple consecutive years, reveals how widespread economic insecurity was even before the pandemic. More than 1 in 4 households, including more than 1 in 3 households with children, experienced a major form of hardship — specifically, an inability to afford adequate food, shelter, or utilities — in one or more of the years 2014, 2015, and 2016. Among Black and Latino households with children, roughly 1 in 2 reported one of these hardships, as did more than 1 in 4 white households with children.
Even many households who are currently in the middle of the income scale may encounter hardship over time. Among the middle third of households with children (ranked by their current annual income), nearly 1 in 3 reported one of these hardships over that three-year span, either because their annual incomes were lower in one of the two other years or because they experienced hardship despite having middle incomes.[33]
Some temporary policies put in place during the pandemic proved effective at combatting problems that long predated the pandemic and point the way to policy advances the nation should adopt permanently. The most notable examples are policies to better support children in families with low incomes: an expanded Child Tax Credit that provides the full credit to children in the lowest-income families, increased support for child care and housing, and summer food benefits to prevent an increase in food insecurity when school is out. Congress took a modest step in December 2022 when it created a permanent summer food assistance program in the year-end funding bill; but action in these other areas is needed to make a sizable dent in child poverty.
Building on the strong research base for effective policies in reducing poverty and hardship, supporting healthy child development, and broadening opportunity, policymakers should make the investments needed to address economic and health insecurity and glaring disparities in hardship and opportunity across lines of race and ethnicity. These investments would help families meet everyday challenges, with all the long-term payoffs that economic security for children provides. They would also ensure that the nation’s economic security infrastructure is prepared to respond more quickly and reliably to meet the needs of families and the economy in the next recession or economic crisis.[34]
This appendix provides some more detailed explanation of our methods and discusses some data quality issues of the Current Population Survey (CPS), which is the main source for the poverty estimates that Census produces and those we present in this report.
In this report we use the terms “economic security programs,” “government assistance,” and “government benefits” interchangeably. In our calculations these benefits include: Social Security, unemployment insurance, workers’ compensation, veterans’ benefits, Temporary Assistance for Needy Families (TANF), state General Assistance, Supplemental Security Income (SSI), SNAP, the National School Lunch Program, the Special Supplemental Nutrition Program for Women, Infants, and Children (WIC), rental assistance (such as Section 8 and public housing), home energy assistance, the EITC, and the Child Tax Credit. Benefit figures for 2008-2010 also reflect a number of temporary federal benefits enacted in response to the Great Recession: the 2008 stimulus payment, 2009 economic recovery payment, and 2009-2010 Making Work Pay Tax Credit. Benefit figures for 2020-2021 include economic impact payments and figures for 2021 include broadband assistance. Taxes, subtracted from family resources, are family members’ federal and state income and payroll taxes.
Precise year-to-year poverty comparisons in the CPS are hampered in recent years by three challenges: the pandemic’s effect on data collection, recent methodological changes in the CPS, and the timing of certain government assistance payments. Even after accounting for all three of these issues, however, the data show that poverty reached a record low in 2021.
The pandemic’s effect on CPS data collection made figures less reliable, particularly in the case of figures for 2019, collected in 2020. A Census assessment noted that fewer people completed the survey than usual in the pandemic, especially those with low incomes; it concluded that Census’ own median household income figures were likely about 2.9 percent too high in 2019 and 2.0 percent too high in 2020 as a result.[35] Supplemental poverty rates were likely 0.3 percentage points too low in 2019 and 0.2 percentage points too low in 2020.[36] Adjusted data are not available for 2021, but even if we were to adjust the 2021 poverty rate upwards by 0.3 percentage points, 2021 would still be a record low poverty year. The SPM poverty rate in 2021 was 7.8 percent compared to 9.1 percent in 2020, the previous record low.
A second challenge in the CPS was a set of recent changes the Census Bureau made to its survey processing system, which make data for 2018 and later not strictly comparable to earlier years. But Census provides enough data on this survey transition to make clear that poverty in 2021 reached a record low even compared to years before 2018. Using data comparable over the period 1967-2017, the poverty rate in 2017 stood at a then record low of 13.9 percent. Using data comparable to 2018 and later, Census recomputed the 2017 poverty rate to be 13.0 percent. The 2021 poverty rate of 7.8 percent is much lower than that recomputed 13.0 poverty rate, and therefore lower than the years before.
A third data issue is how to count certain government payments made at the cusp between 2020 and 2021. Most U.S. residents received $600-per-person stimulus payments in a second round of COVID Economic Impact Payments (EIP2s). Counting the approximately $141 billion in EIP2 payments when they were made — overwhelmingly in the first two months of 2021[37] — would lower the SPM poverty rate in 2021 from 7.8 percent to 6.9 percent. Census counted these payments as 2020 income, following long-standing Census practice to count tax-based benefits in the relevant tax year.[38] In addition, we calculate that if Census had counted EIP2s in 2021 rather than 2020, SPM poverty would have been 3.8 million people (about 1.2 percentage points) higher in 2020. From 2020 to 2021, the number of individuals in poverty would have declined by some 6.6 million more than under Census’ approach to counting the payments.
Appendix Table 1 shows poverty rates using different methodological adjustments discussed in this section. Taking these into account is particularly important when making year-to-year comparisons. For example, to accurately compare 2017 and 2018 one should use data based on the updated processing system for both years. Using those data, poverty fell by 0.3 percentage points between 2017 and 2018. If instead one used the old processing system data for 2017 (13.9 percent) and the new processing data for 2018 (12.7 percent), one would erroneously conclude that poverty fell by over 1 percentage point. Similarly, when comparing 2018 to 2019, it’s best to use the Census weights that adjust for non-response bias. Using those adjusted weights, one finds that poverty fell by 0.6 percentage points between 2018 and 2019. Without using those adjusted weights, one would erroneously conclude that poverty fell by a whole percentage point in 2019.
| APPENDIX TABLE 1 |
|---|
|
| | Old processing system, original weights | New processing system, original weights | New processing system, non-response-adjusted weights | New processing system, original weights, count EIP2s in year payments made |
|---|
| All ages |
| 2016 | 13.9% | 13.5% | 13.4% | |
| 2017 | 13.9% | 13.0% | 12.8% | |
| 2018 | | 12.7% | 12.6% | |
| 2019 | | 11.7% | 12.0% | |
| 2020 | | 9.1% | 9.3% | 10.3% |
| 2021 | | 7.8% | | 6.9% |
| Under 18 |
| 2016 | 15.2% | 14.8% | 14.8% | |
| 2017 | 15.6% | 14.2% | 14.0% | |
| 2018 | | 13.6% | 13.6% | |
| 2019 | | 12.4% | 12.8% | |
| 2020 | | 9.7% | 9.8% | 11.3% |
| 2021 | | 5.2% | | 4.2% |
Main Findings Are Similar When Using Relative Rather Than Anchored SPM Thresholds
Unless otherwise noted, figures in this report use an SPM threshold “anchored” to 2021. That is, poverty is defined as having family resources below the Supplemental Poverty Measure’s poverty threshold established by the Bureau of Labor Statistics for 2021, adjusted in earlier years for inflation using the Labor Department’s consumer price index retroactive series. (The threshold is also adjusted for family size and composition, home ownership status, and local housing costs. In 2021, this threshold was $31,453 for a two-adult two-child family renting in an average-cost community.) Figures may differ from figures in previous CBPP reports that were anchored to an earlier year or published Census SPM figures, which are not anchored.
Another version of the SPM — the unanchored or “relative” SPM — takes into account evolving societal standards of poverty over long periods of time by updating the poverty thresholds each year based on gradual changes in what most families spend on basic necessities.[39]
Poverty declines less over the long term when a relative SPM poverty measure is used; that’s because under a relative measure, the poverty threshold in earlier years is lower in inflation-adjusted terms than the threshold in 2021. As the amount that families spend on necessities rises in real terms, the relative measure’s poverty threshold rises in inflation-adjusted terms.
But under both relative and anchored versions of the poverty measure, poverty rates reached record lows in 2020 and 2021, overall and for children. Similarly, under both measures, the decline in the number and percentage of people poverty in 2020 were the largest on record, and the decline in the number and percentage of children in poverty in 2021 were the largest on record, in data back to 1967.
This analysis uses an anchored series to ensure that trends are purely due to changes in families’ resources, not changes in the poverty thresholds, in accordance with this paper’s focus on the evolving role of government assistance. (Census’ official poverty measure also uses thresholds that are adjusted each year only for inflation.)
The supplemental tables in Appendix II of this report include trends using both the anchored and relative SPM thresholds.
Census’ counts of program participants typically fall well short of the totals shown in actual administrative records. Such underreporting is common in household surveys and can affect estimates of poverty. The extent of underreporting can vary by program and by year. In 2020, less than one-half of unemployment benefits and SNAP benefits were captured by the CPS. In 2021, less than one-third were. This implies that the anti-poverty effectiveness of those programs could be at least twice as high as what the uncorrected data suggests in those years. Programs like SSI that provide regular monthly payments that people receive over longer periods tend to be underreported less. Roughly 90 percent of SSI benefits were captured by the CPS in 2020 and 2021. (See Appendix Table 2.)
| APPENDIX TABLE 2 |
|---|
|
| | 2018 | 2019 | 2020 | 2021 |
|---|
| Unemployment Insurance |
| Administrative data (NIPA) | 28 | 28 | 537 | 339 |
| Survey data (CPS) | 15 | 18 | 218 | 90 |
| Percent captured by CPS survey | 56% | 64% | 41% | 26% |
| SNAP |
| Administrative data (NIPA) | 58 | 55 | 95 | 150 |
| Survey data (CPS) | 29 | 25 | 39 | 46 |
| Percent captured by CPS survey | 50% | 47% | 41% | 31% |
| SSI |
| Administrative data (NIPA) | 57 | 58 | 58 | 57 |
| Survey data (CPS) | 48 | 48 | 50 | 52 |
| Percent captured by CPS survey | 85% | 84% | 87% | 92% |
The figures in this report do not correct for underreporting of benefits. In previous analyses, we have corrected for the underreporting of SNAP, SSI, and TANF benefits using data from the Transfer Income Model (TRIM) produced by the Urban Institute for the U.S. Department of Human Services Assistant Secretary for Planning and Evaluation. We do not use TRIM data in this report since they are not yet available for 2020 or 2021. TRIM data start with the same survey data that the Census Bureau uses but TRIM uses an alternative method of filling in respondents’ skipped survey questions that more closely approximates actual total program participation and payment levels for key benefit programs.
Making these corrections increases the number of people lifted above the SPM poverty line by all government assistance in 2018 from 37 million to 41 million and lowers the poverty rate from 12.7 percent to 11.5 percent. See Appendix Table 3 for program-by-program figures.
| APPENDIX TABLE 3 |
|---|
|
| | SNAP | SSI | TANF |
|---|
| All ages |
| Without corrections | 3.2 | 2.9 | 0.4 |
| Correcting for underreported benefits | 6.0 | 4.0 | 0.7 |
| Children |
| Administrative data (NIPA) | 1.4 | 0.5 | 0.2 |
| Survey data (CPS) | 2.8 | 1.0 | 0.4 |
When analyzing poverty rates for all ages over time, we find that these corrections for underreporting make only a modest difference in most years.[40] However, they matter more for trends in child poverty and in years when government assistance has expanded, such as during the Great Recession.
Correcting for underreporting is also particularly important when measuring “deep” child poverty, often defined as income below half of the poverty line, because underreported benefits make up a larger share of the total income of those with the lowest reported incomes.
For example, correcting for underreported TANF, SSI, and SNAP benefits reveals that the share of children in single-mother families living in poverty fell but the share living in deep poverty rose during the first decade after policymakers made major changes in the public assistance system in the mid-1990s that made SNAP and TANF less available and accessible to poor families, as we reported in 2020. That paper focuses on children in single-mother families (the population most affected by the cash assistance changes under the 1996 law that created TANF) between the years 1995 and 2005. This period, the first decade under the new law, is suitable for assessing the law because the years represent comparable points in the business cycle; 2005 also predates benefit expansions during the Obama Administration including the ACA, which lowered deep poverty by lowering families’ out-of-pocket medical expenses. The paper finds that deep poverty for children in single-mother families rose from 5.4 percent in 1995 to 7.4 percent in 2005.[41]
Another way to correct for the underreporting of government benefits is to augment survey data by linking it with actual payment data from survey respondents’ confidential program records. A recent Census Bureau working paper uses multiple linked administrative sources to correct underreporting of earnings and a variety of other cash income sources. This lowers the official child poverty rate by 0.57 percentage points, not a statistically significant change.[42] So far, no analysis using linked data has examined deep poverty in single-mother families with a Supplemental Poverty Measure that corrects for the underreporting of TANF, SSI, and SNAP in the key years of 1995 and 2005.
The CPS does not ask families directly about taxes or tax credits; instead, Census estimates them for families, which avoids adding needlessly to an already long survey.[43] Census bases its estimates on respondents’ survey income. One limitation of the approach is that in practice the credit is not received until the family files its taxes the following year. Families that anticipate receiving a tax credit, however, may reduce their tax withholding accordingly and see higher take-home pay in the current year.
Another limitation of Census’ tax estimates is that they do not account for restrictions on EITC and Child Tax Credit eligibility for filers or dependents who lack a Social Security number, which bars certain families that include immigrants from receiving these credits. Accounting for this restrictive policy would reduce the anti-poverty effects of these tax credits and would increase the estimated poverty rates for certain groups. In particular, it could increase estimated poverty rates perhaps by nearly 3 percentage points for Latino children and nearly 1 percentage point for Asian children.[44]
A final limitation of Census’ tax estimates is that they assume 100 percent participation in tax credits among eligible families, and no participation among ineligible families. It is challenging to assess whether Census’ tax estimates overstate or understate the tax system’s effect on poverty as a result. One study matched Census’ tax estimates with each survey member’s confidential IRS records and found many people receiving no EITC despite appearing eligible in the survey data while other filers received payments despite appearing possibly ineligible (though they usually had low incomes).
On balance, actual EITC payments lower poverty rates by 1.2 percentage points in the linked data for 2014, rather than the 1.5 percentage points Census’ approach indicates.[45] On the other hand, in dollar terms, the EITC and the Child Tax Credit are not overcounted in the CPS. The CPS estimates show a total of $39 billion in EITC payments and $113 billion in Child Tax Credit payments in 2020, less than the actual $62 billion in EITC payments and $119 billion in Child Tax Credit payments shown in IRS records.[46]
Accounting for immigration-related restrictions in the EITC and Child Tax Credit and less than 100 percent participation in the credits, however, would be unlikely to change the conclusions that poverty rates reached record lows in 2021 both overall and for children, and the one-year declines in poverty in 2020 and children’s poverty in 2021 were the largest on record.
As impressive as the poverty reductions of 2020 and 2021 are, it is also important to keep in mind that the poverty figures here reflect annual income as calculated by the Census Bureau. Households in need in the pandemic did not always receive benefits as quickly as needed. One lesson of the pandemic is that many households’ needs could have been met faster if unemployment insurance eligibility rules and administrative systems had been modernized before the pandemic and if the expansion of the Child Tax Credit in 2021, including full refundability and monthly payments, had already been in place.
Supplemental tables can be accessed here:
https://www.cbpp.org/sites/default/files/spm_appendix_final.xlsx
| Tables using 2021 SPM poverty line adjusted for inflation |
- Appendix II Table 1a. Effect of Government Assistance and Taxes on Poverty by Race/Ethnicity (All Ages, Rates)
|
- Appendix II Table 2a. Effect of Government Assistance and Taxes on Poverty by Race/Ethnicity (All Ages, Sums)
|
- Appendix II Table 3a. Effect of Government Assistance and Taxes on Poverty by Race/Ethnicity (Under 18, Rates)
|
- Appendix II Table 4a. Effect of Government Assistance and Taxes on Poverty by Race/Ethnicity (Under 18, Sums)
|
- Appendix II Table 5a. Effect of Government Assistance and Taxes on Poverty by Age and Family Structure (Rates)
|
- Appendix II Table 6a. Effect of Government Assistance and Taxes on Poverty by Age and Family Structure (Sums)
|
- Appendix II Table 7a. Effect of Specified Government Assistance and Taxes on Poverty by Race/Ethnicity (All Ages)
|
- Appendix II Table 8a. Effect of Specified Government Assistance and Taxes on Poverty by Race/Ethnicity (Under 18)
|
- Appendix II Table 9a. Effect of Government Assistance and Taxes on Poverty Using Data Corrected for Underreporting of Key Benefits
|
- Appendix II Table 10a. Effect of Correcting for Underreporting of Key Benefits by Race/Ethnicity (2018)
|
- Appendix II Table 11a. Effect of Correcting for Underreporting of Key Benefits (1993-2017, all ages)
|
- Appendix II Table 12a. Effect of Correcting for Underreporting of Key Benefits (1993-2017, under 18)
|
| |
| Tables using "relative" SPM thresholds (that is, adjusted annually for changes in basic needs spending) |
- Appendix II Table 1b. Effect of Government Assistance and Taxes on Poverty by Race/Ethnicity (All Ages, Rates)
|
- Appendix II Table 2b. Effect of Government Assistance and Taxes on Poverty by Race/Ethnicity (All Ages, Sums)
|
- Appendix II Table 3b. Effect of Government Assistance and Taxes on Poverty by Race/Ethnicity (Under 18, Rates)
|
- Appendix II Table 4b. Effect of Government Assistance and Taxes on Poverty by Race/Ethnicity (Under 18, Sums)
|
- Appendix II Table 5b. Effect of Government Assistance and Taxes on Poverty by Age and Family Structure (Rates)
|
- Appendix II Table 6b. Effect of Government Assistance and Taxes on Poverty by Age and Family Structure (Sums)
|
- Appendix II Table 7b. Effect of Specified Government Assistance and Taxes on Poverty by Race/Ethnicity (All Ages)
|
- Appendix II Table 8b. Effect of Specified Government Assistance and Taxes on Poverty by Race/Ethnicity (Under 18)
|
- Appendix II Table 9b. Effect of Government Assistance and Taxes on Poverty Using Data Corrected for Underreporting of Key Benefits
|
- Appendix II Table 10b. Effect of Correcting for Underreporting of Key Benefits by Race/Ethnicity (2018)
|
- Appendix II Table 11b. Effect of Correcting for Underreporting of Key Benefits (1993-2017, all ages)
|
- Appendix II Table 12b. Effect of Correcting for Underreporting of Key Benefits (1993-2017, under 18)
|
