BEYOND THE NUMBERS
Added Funding Needed to Prevent Harmful Cuts to Housing Vouchers and Other Rental Assistance Programs in 2024
As Congress finalizes 2024 appropriations bills, it should prioritize fully renewing Housing Choice Vouchers by providing a significant increase over 2023 funding levels to avoid a sharp reduction in the number of families receiving help to afford stable housing. People left without vouchers would be at high risk of eviction and potentially homelessness.
The Housing Choice Voucher program is the country’s largest rental assistance program, helping households with low incomes afford a home of their choice in the private market. Housing vouchers are tied to rental costs, so they require annual, inflation-related funding increases to continue serving the same number of families — which is already only about a quarter of those in need due to existing funding limitations.
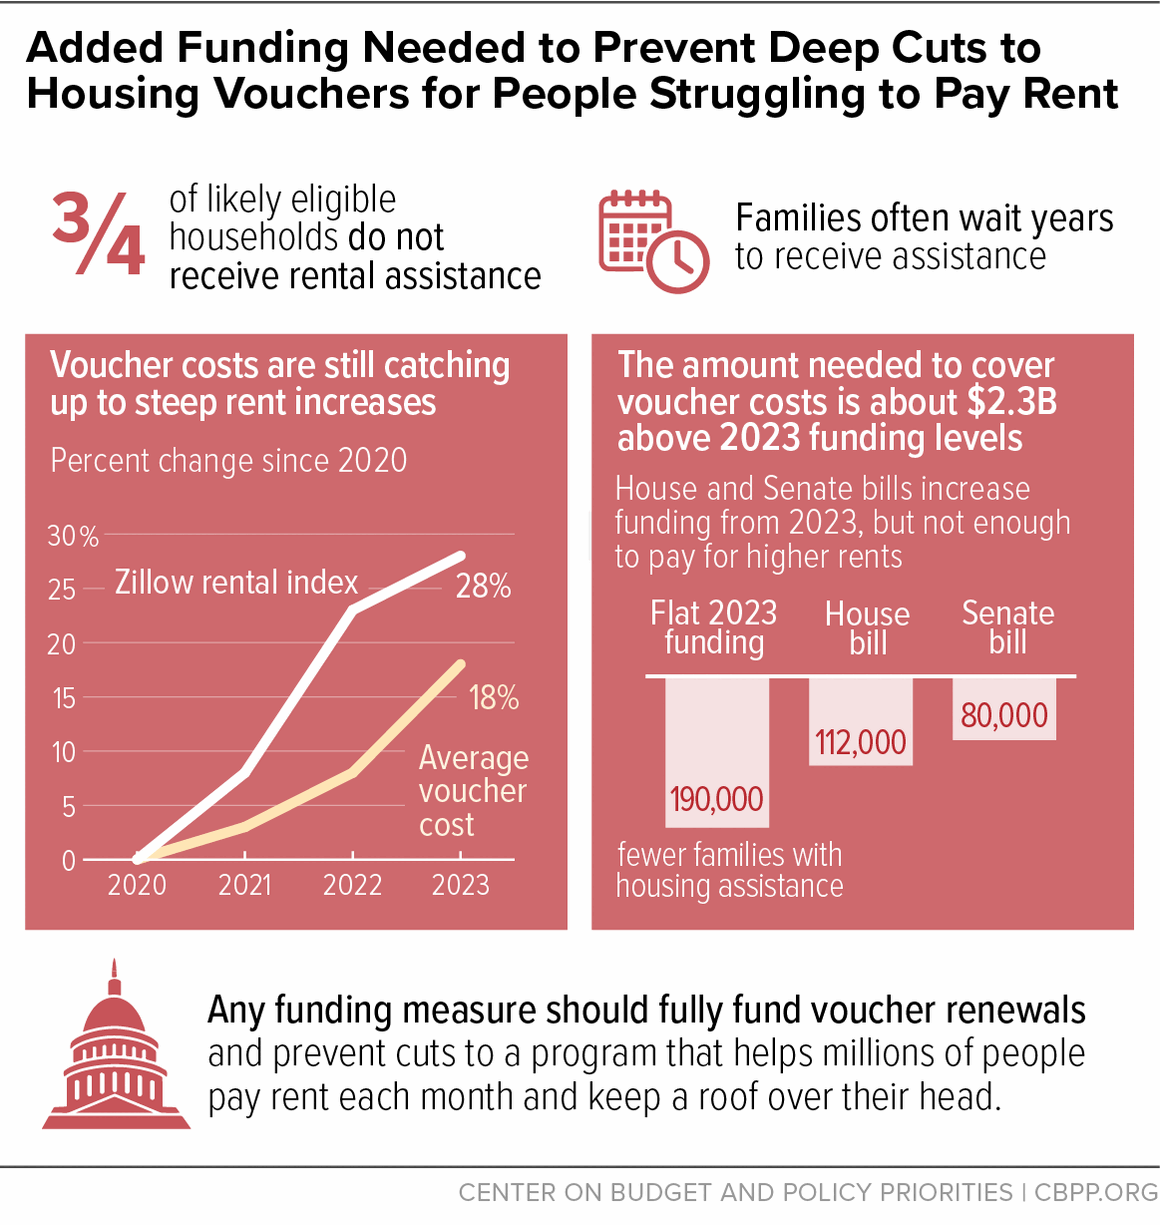
Using the most recent Department of Housing and Urban Development (HUD) data on program costs and likely rent inflation in 2024, we estimate that the cost to retain existing vouchers is about $2.3 billion above 2023 levels, even assuming that part of the shortfall is covered using housing agencies’ reserves. The 2024 funding bills passed by the House Appropriations Committee and the Senate increase funding, but not by enough to cover the cost of all existing vouchers.
The House bill provides funding that is $1.4 billion less than the estimated need, and the Senate bill falls short by about $962 million — which would result in roughly 112,000 and 80,000 fewer families receiving needed assistance, respectively. (See graphic and Table 1.) And if Congress kept funding flat for Housing Choice Vouchers in 2024, roughly 190,000 fewer families would receive assistance.
Congress should also adequately fund other rental assistance programs, such as public housing, as well as Homeless Assistance Grants, which help people connect with emergency shelters and the services they need to obtain and maintain stable housing. Not providing sufficient funding for housing vouchers and these other programs in 2024 would hamper efforts to address increases in homelessness, evictions, and a lack of affordable housing and would likely lead to increases in the harm that people across the country face due to high rent costs.
Moreover, cuts would disproportionately harm people of color, particularly Black and Latine households, who are more likely to be receiving or eligible for rental assistance due to structural racism and other barriers to opportunity in housing, education, and employment. The impacts of systemic discrimination in employment and other inequities also result in women and people with disabilities disproportionately utilizing housing vouchers — thus they are more likely to be harmed by cuts. And about 41 percent of people in voucher-assisted households are children, compared to 36 percent of all renter households.
People left without rental assistance are far more likely to experience homelessness, overcrowding, evictions, and other forms of housing instability. Because existing funding levels are limited, there are long waiting lists for assistance in nearly all parts of the country. HUD recently released new data finding that over 650,000 people were experiencing homelessness on a single night in January 2023, with people of color overrepresented. This is an unprecedented level of homelessness — never before seen in HUD’s annual Point-in-Time count — and it reflects a 12 percent increase over 2022.
Given these staggering numbers, it should be a priority to maintain — and in the coming years, expand — the Housing Choice Voucher program, which helps address the main driver of homelessness and housing instability: the gap between low incomes and rent costs.
Higher voucher costs are expected largely because the program is continuing to absorb the rapid increases in market rents in recent years. Market rents increased by 28 percent from June 2020 to June 2023, according to Zillow rental data. During the same period, the average cost of a voucher increased by only 18 percent.
While the rate of market rent increases has moderated, voucher costs tend to lag the rental market in part because they are limited by subsidy caps — known as fair market rents, or FMRs — that HUD sets at the beginning of each fiscal year using a formula that includes retroactive rent data. FMRs rose by an average of 12 percent for 2024. That’s more than the rate at which rents are currently rising, but it’s needed to enable voucher subsidies to catch up to typical market rents and help ensure that families with vouchers can successfully rent homes.
Another reason for the higher costs is that housing agencies have succeeded in using a larger share of the vouchers they administer, helping more people in need. Many voucher holders struggled to find homes they could rent in the tight housing market of the past few years, but HUD and local housing agencies have taken effective steps to make vouchers easier to use. These efforts, along with some easing of market conditions, helped housing agencies assist more than 27,000 additional families in October 2023 (the most recent data available) compared to the end of 2022.
If Congress provides less than the estimated $28.7 billion needed for voucher renewals, the number of households receiving assistance will fall. Regaining vouchers lost — particularly at the level we are estimating — can often take years. For example, the number of families using housing vouchers fell by about 100,000 after the 2013 sequestration cuts under the Budget Control Act. Congress increased funding in 2014 and 2015, but agencies were only able to restore about half of the vouchers lost by December 2015.
Because vouchers are such a critical tool for providing safe, stable housing for people with low incomes, Congress should prioritize ensuring that its final 2024 appropriations bills provide enough resources to prevent cuts in assistance.
| TABLE 1 | ||
|---|---|---|
| Reduction in Number of Families Assisted, by State | ||
| State | Vouchers Lost Under House Bill | Vouchers Lost Under Senate Bill |
| Alabama | 1,600 | 1,200 |
| Alaska | 200 | 200 |
| Arizona | 1,000 | 700 |
| Arkansas | 1,100 | 800 |
| California | 15,100 | 10,700 |
| Colorado | 1,500 | 1,100 |
| Connecticut | 1,900 | 1,400 |
| Delaware | 200 | 200 |
| District of Columbia | 600 | 400 |
| Florida | 5,200 | 3,700 |
| Georgia | 2,700 | 2,000 |
| Hawai’i | 600 | 400 |
| Idaho | 300 | 200 |
| Illinois | 4,800 | 3,400 |
| Indiana | 1,900 | 1,300 |
| Iowa | 1,000 | 700 |
| Kansas | 500 | 400 |
| Kentucky | 1,700 | 1,200 |
| Louisiana | 2,300 | 1,700 |
| Maine | 600 | 400 |
| Maryland | 2,500 | 1,800 |
| Massachusetts | 4,400 | 3,200 |
| Michigan | 2,800 | 2,000 |
| Minnesota | 1,600 | 1,100 |
| Mississippi | 1,300 | 900 |
| Missouri | 1,900 | 1,300 |
| Montana | 300 | 200 |
| Nebraska | 600 | 400 |
| Nevada | 700 | 500 |
| New Hampshire | 500 | 400 |
| New Jersey | 3,800 | 2,700 |
| New Mexico | 600 | 400 |
| New York | 11,700 | 8,300 |
| North Carolina | 2,700 | 1,900 |
| North Dakota | 300 | 200 |
| Ohio | 4,400 | 3,100 |
| Oklahoma | 1,100 | 800 |
| Oregon | 1,800 | 1,200 |
| Pennsylvania | 3,800 | 2,700 |
| Rhode Island | 400 | 300 |
| South Carolina | 1,200 | 900 |
| South Dakota | 300 | 200 |
| Tennessee | 1,700 | 1,200 |
| Texas | 7,200 | 5,100 |
| Utah | 600 | 400 |
| Vermont | 400 | 300 |
| Virginia | 2,400 | 1,700 |
| Washington | 2,800 | 2,000 |
| West Virginia | 700 | 500 |
| Wisconsin | 1,300 | 900 |
| Wyoming | 100 | 88 |
| Guam | 100 | 85 |
| Northern Mariana Islands | 17 | 12 |
| Puerto Rico | 1,400 | 1,000 |
| U.S. Virgin Islands | 73 | 52 |
| Total Households | 112,000 | 80,000 |
| TABLE 2 | ||
|---|---|---|
| Racial and Ethnic Demographics of Households Harmed by Housing Voucher Shortfall | ||
| Under House Bill | Under Senate Bill | |
| Black | 54,000 | 38,400 |
| Native American/Alaska Native | 1,100 | 800 |
| Asian/Pacific Islander | 3,400 | 2,400 |
| Latine | 20,200 | 14,400 |
| White | 33,700 | 24,000 |
| TABLE 3 | ||
|---|---|---|
| Demographics of Individuals Harmed by Housing Voucher Shortfall | ||
| Under House Bill | Under Senate Bill | |
| Children | 101,400 | 72,100 |
| Older Adults | 32,100 | 22,900 |
| People with Disabilities | 59,300 | 42,200 |
| Women and Girls | 153,300 | 109,000 |
| Total Individuals | 247,300 | 175,800 |
