BEYOND THE NUMBERS
What’s Driving Projected Debt?
As we’ve noted, my colleagues Kathy Ruffing and Jim Horney have updated CBPP’s analysis showing that the economic downturn, President Bush’s tax cuts, and the wars in Afghanistan and Iraq explain virtually the entire federal budget deficit over the next ten years. So, what about the public debt, which is basically the sum of annual budget deficits, minus annual surpluses, over the nation’s entire history?
The complementary chart, below, shows that the Bush-era tax cuts and the Iraq and Afghanistan wars — including their associated interest costs — account for almost half of the projected public debt in 2019 (measured as a share of the economy) if we continue current policies.
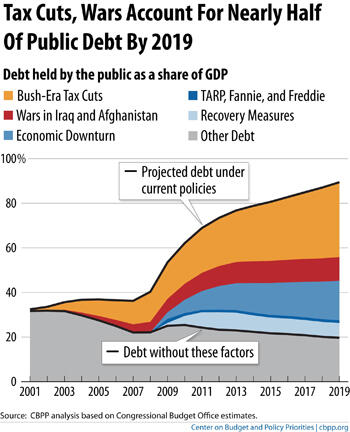
Altogether, the economic downturn, the measures enacted to combat it (including the 2009 Recovery Act), and the financial rescue legislation play a smaller role in the projected debt increase over the next decade. Public debt due to all other factors fell from over 30 percent of GDP in 2001 to 20 percent of GDP in 2019.
We focus here on debt held by the public, which reflects funds that the federal government borrows in credit markets to finance deficits and other cash needs. That’s the proper measure on which to focus because it’s what really affects the economy. We compare it to GDP because stabilizing the debt-to-GDP ratio is a key test of fiscal sustainability.
As Kathy and Jim note, simply letting the Bush tax cuts expire on schedule (or paying for any portions that policymakers decide to extend) would stabilize the debt-to-GDP ratio for the next decade. While we’d have to do much more to keep the debt stable over the longer run, that would be a huge accomplishment.