BEYOND THE NUMBERS
Income Inequality Remains at Record High, New Census Figures Show
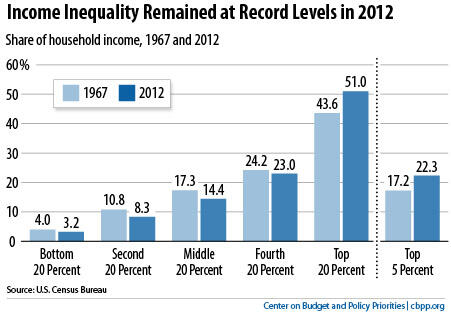
The shares of the nation’s income going to each of the bottom 60 percent of households in 2012 remained at 2011’s record low levels in data that go back to 1967, today’s Census Bureau report shows. The share going to the top 20 percent was statistically unchanged at last year’s record highs (see graph).
The bottom 20 percent of households received just 3.2 percent of all household income in 2012, and the middle fifth received only 14.4 percent. Meanwhile, the top 20 percent of households got 51 percent, and the top 5 percent of households garnered 22.3 percent.
A recent study suggests that the income inequality trends that Census reported today may underestimate how much inequality is growing, because of gaps in how Census collects and reports data, especially its omission of substantial income going to top earners. Using preliminary tax data, which is more accurate for the highest-income households, economist Emmanuel Saez finds that the share of the nation’s total income going to the top 10 percent of households rose in 2012 to its highest level on record, with data available back to 1917.
Saez finds that the average incomes of the top 1 percent rose sharply in 2012 — by 19.6 percent — while the incomes of the other 99 percent grew by just 1 percent. This means that, on average, the income of the top 1 percent grew by more than $200,000 — about four times as much as the total income of the median household in 2012.
The disparity in incomes is even larger when the highest-income households are considered, Saez reports. The incomes of households in the top one-tenth of 1 percent rose by an average of nearly $1.4 million in 2012, or 27 times median household income.