Where Do Our State Tax Dollars Go?
http://www.offthechartsblog.org/where-do-our-state-tax-dollars-go/
Posted by: Elizabeth McNichol
Posted in: Federal-State Issues, State Budget and Tax, Taxes
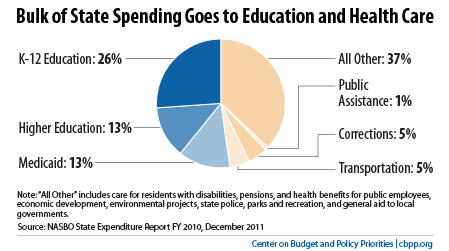
As the April 17 tax-filing deadline approaches, we’re taking time this week to examine where our tax dollars go. Earlier this week, we looked at what federal tax dollars pay for. Today, we turn to the state level.
States spend more than half of our tax dollars on education and health care, on average.

Click here for the latest update of our Policy Basic on this issue.


How convenient that you club a lot of things into that “All Others” category which is the biggest chunk at 37% and use the fine print to list them, Public Employees’ health benefits and pensions.
How about you break these two out separately and then show us the breakup. That will be an eye opener and I am sure you wouldn’t what that seen.
Thanks for the comment.
The data collected by the National Association of State Budget Officers, on which this chart is based, do not separately identify spending on employee benefits. We have another report that focuses specifically on state and local employees and has more detail on pay and benefits; see http://www.cbpp.org/files/2-24-11sfp.pdf.
Because providing services is the primary business of states, labor costs — i.e., wages and benefits — do make up a significant share of their annual spending. We estimate that. on average, wages plus benefits (such as health insurance and retirement) make up about 20 percent of state general spending, using data from the Census Bureau and the Bureau of Labor Statistics. Wages account for most of this total—15 percent of state spending.
Am I correct in concluding that local government expenditures are not included in this chart?
Since state subdivisions (municipalities) pay for services that satisfy state obligations and from the point-of-view of the citizen are indistinguishable from those paid for out of “state” revenues, it seems to me that a chart (especially, a pie chart which I read as showing where my tax dollars go) that does not include those payments is incomplete and misinforms.
– Thanks for the question.
– Yes, this chart and the accompanying issue brief show the breakdown only of state spending, but we don’t think that misinforms. The three levels of government in the United States — federal, state and local — are inter-related, but have distinct programs and spending patterns.
– The spending pattern for local governments is different from that of states. Cities, counties, school districts, and other local governments, on average, spend a larger share of their budgets on K-12 education and on transportation and a smaller share on healthcare and higher education.
– One could do a chart that combines state and local spending, but that’s a different chart.