BEYOND THE NUMBERS
In recognition of Tax Day, we’ve collected our top ten charts related to federal taxes. Together, they provide useful context for ongoing debates about how to reduce deficits and reform the tax code.
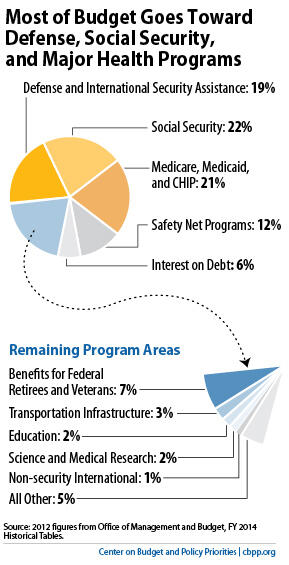
Our first chart, below, reminds us what taxes pay for. National defense, Social Security, and major health programs like Medicare and Medicaid account for roughly three-fifths of federal spending. Safety net programs and interest on the debt account for 12 percent and 6 percent of federal spending, respectively, while the remaining 20 percent goes to other areas such as roads, education, and health and science research.
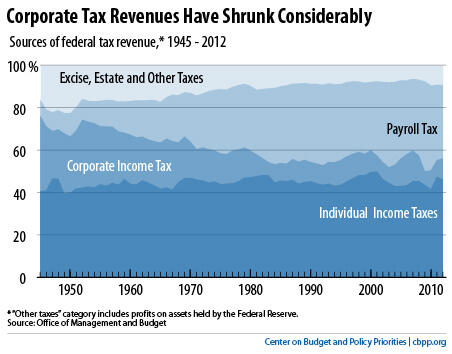
Our second chart, below, shows where federal revenues come from. Individual income taxes make up a little under half of all federal revenues — and have for more than half a century.
Payroll taxes make up a much larger share of federal revenues than in earlier decades, while corporate income taxes make up a much smaller share. In fact, corporate tax revenues are near record lows when measured as a share of the economy, even though corporate profits are at historic highs.
Many business leaders have called for cutting the top U.S. statutory corporate tax rate of 35 percent, which is high by international standards. But the average tax rate — that is, the share of their profits that companies actually pay in U.S. taxes — is much lower because of the many deductions, credits, and other write-offs that corporations can take. Many corporations pay very little tax.
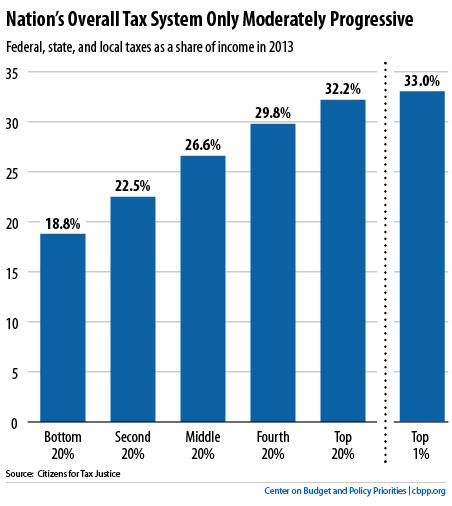
As for taxes on individuals, the country’s overall tax system — counting state and local taxes as well as federal taxes — is modestly progressive, as our third chart, below, shows. Low-and moderate-income Americans pay significant shares of their income in taxes.
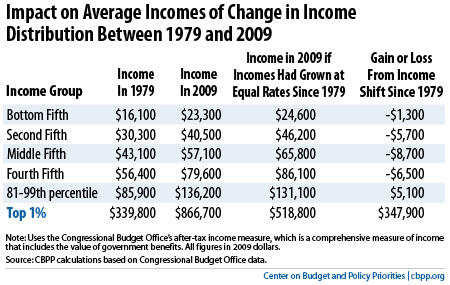
Policymakers considering changes in tax policy must keep in mind the economic context, including the dramatic increase in inequality in recent decades. Congressional Budget Office data show that incomes grew at much faster rates for high-income people than for everyone else between 1979 and 2009 (the most recent year available).
One way to look at the impact of this unequal growth is to compare the average 2009 income for households in different income groups to what it would have been if the income of every group had grown at the same rate since 1979.
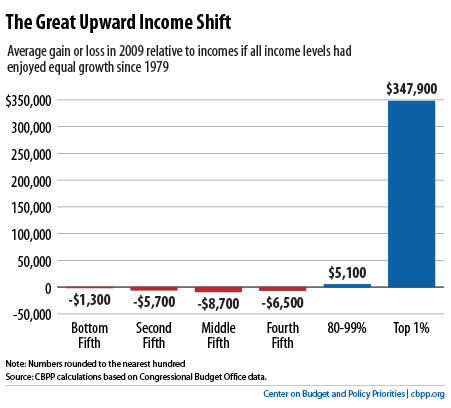
Our fourth chart, below, and the accompanying table give the results. They show, for example, that the average middle-income family had $8,700 less after-tax income in 2009, and an average household in the top 1 percent had $349,000 more, than if incomes of all groups had grown at the same rate since 1979.
The sharp growth in income inequality suggests that higher-income taxpayers can and should contribute more in taxes to help reduce deficits.
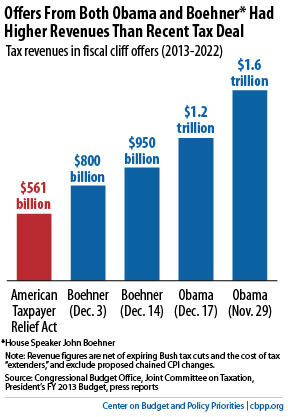
The fifth chart, below, shows that both parties have recognized the need to raise more revenue to help reduce deficits. During the December 2012 budget negotiations between President Obama and House Speaker John Boehner, both sides called for much larger tax increases than those in the January 2013 “fiscal cliff” deal, the American Taxpayer Relief Act (ATRA), as the fifth chart, below, shows.
Moreover, the bulk of the deficit savings enacted to date — including ATRA and earlier legislation, most notably the 2011 Budget Control Act (BCA) — have come from spending cuts rather than revenues.
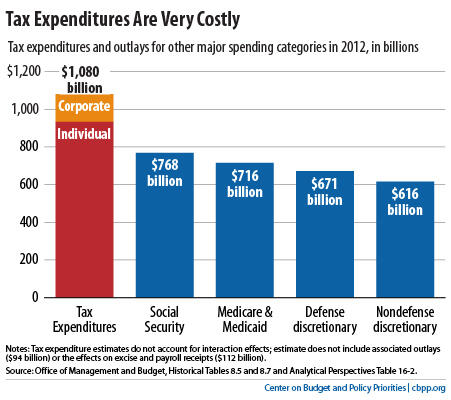
An obvious place to turn for more revenue is reforming tax expenditures. As a group, they cost more than Social Security or Medicare and Medicaid combined, as our sixth chart, below, shows.
Both parties have recognized the need for tax expenditure reform. For example, Speaker Boehner’s December 3 offer called for raising $800 billion in revenues entirely through tax expenditure reforms. And Harvard economist Martin Feldstein, former chair of President Reagan’s Council of Economic Advisers, has said that “cutting tax expenditures is really the best way to reduce government spending.”
Tax expenditures are not only costly; many share a design flaw that makes them both economically inefficient and inequitable. Because their value is based on a person’s tax rate, it rises as income rises, so the biggest subsidies go to higher-income people — even though they least need a subsidy to do what the subsidy is supposed to encourage, like buy a house or donate to charity.
The mortgage interest deduction is a good example, as our seventh chart shows.
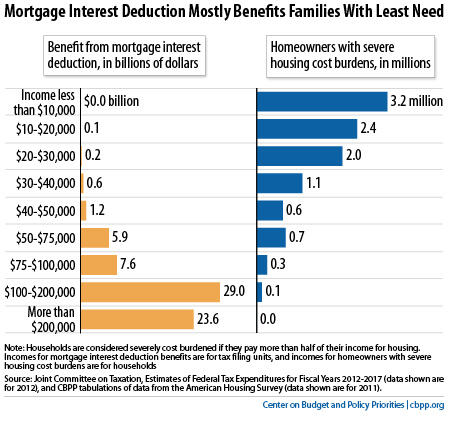
The design of the mortgage interest deduction is “upside down.” For example, an investment banker making $675,000 pays about 65 cents per dollar of mortgage interest, and the taxpayers pick up the remaining 35 cents. By contrast, a schoolteacher making $45,000 pays 85 cents of every dollar of mortgage interest and taxpayers pick up 15 cents. Thus the banker’s subsidy represents a greater share of the banker’s mortgage interest expenses than is the case for the schoolteacher. In addition, the high-income banker is likely to have a more expensive house and thus a larger mortgage than the schoolteacher, further increasing the disparity in the subsidy each receives.
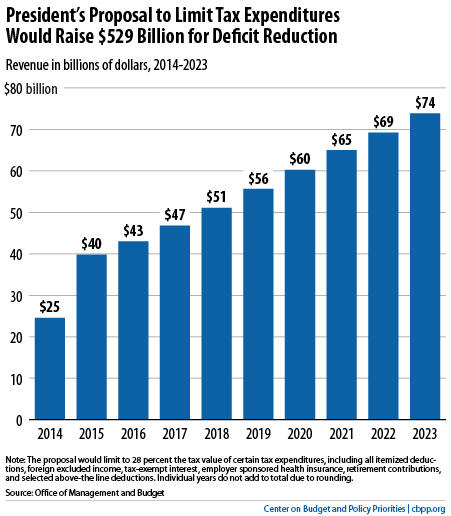
Because it could prove politically difficult to reform tax expenditures on a case-by-case basis, several recent proposals would impose an across-the-board limit on tax expenditures for high-income people.
The soundest of these proposals is President Obama’s proposal to cap the value of certain tax expenditures at 28 percent. The eighth chart, below, shows that this proposal would raise more than half a trillion dollars over the coming decade.
At the same time, policymakers should close loopholes that allow wealthy people to avoid substantial tax.
One example is the tax break that allows investment fund managers to pay taxes on a large part of their income — their “carried interest,” or the right to a share of the fund’s profits — at the 20 percent capital gains tax rate rather than at normal income tax rates of up to 39.6 percent.
As a result of this tax break, a hedge fund manager earning $10 million or more can pay a smaller share of his income in federal income taxes than a middle-income schoolteacher or policeman.
The House-passed Ryan budget also calls for tax expenditure reforms. But, whereas the President’s proposal would use the resulting savings to reduce the deficit, the Ryan budget would use them to pay for a new round of tax cuts.
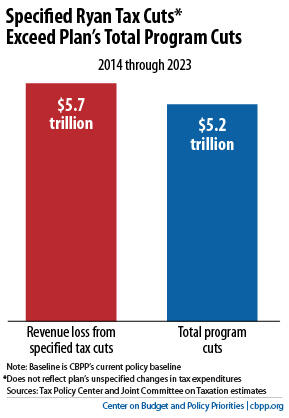
The Ryan budget lays out tax-cut goals that would reduce revenues by $5.7 trillion over ten years, according to the Urban-Brookings Tax Policy Center. It implies that these tax cuts would be fully offset by tax expenditure savings but doesn’t specify any actual changes in tax expenditures to accomplish this. And, as our ninth chart, below, shows, the $5.7 trillion revenue hole that the budget’s tax-cut goals would create is even larger than the budget’s $5.2 trillion in program cuts.
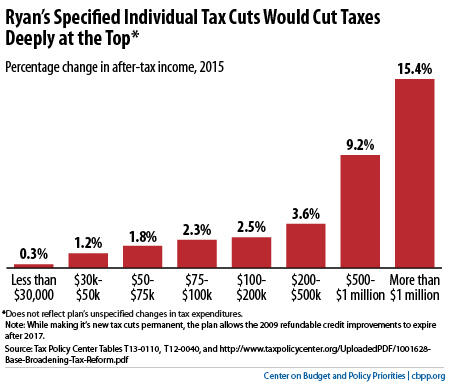
In addition to being extremely costly, the Ryan budget’s tax-cut goals are heavily tilted towards people with the highest incomes, as our tenth chart, below, shows.
We estimate that the individual income tax cuts specified in the budget (assuming they met their goals, including a top rate of 25 percent) would raise after-tax incomes by 15.4 percent among households with annual incomes above $1 million but by just 1.8 percent for households with incomes between $50,000 and $75,000.
In dollar terms, the tax cuts would be worth an average of $330,000 apiece to those millionaire households, compared to $1,700 for the middle-class households.
The revenue levels in the Ryan budget imply that the cost of its tax-cut goals will be offset by scaling back tax expenditures. But Tax Policy Center analyses indicate that if policymakers coupled the Ryan tax-cut goals with sweeping (and likely politically implausible) cuts in tax expenditures for households with incomes above $200,000, these households would still receive a large net tax cut.
As a result, to fully finance the net tax cuts for people with incomes over $200,000, taxes on people below $200,000 would very likely have to rise. Alternatively, if those with incomes under $200,000 were protected from tax increases, then the Ryan tax changes would add mightily to the deficit.
