BEYOND THE NUMBERS
As April 15th — Tax Day — approaches, these ten federal tax charts provide context for some important tax policy issues.
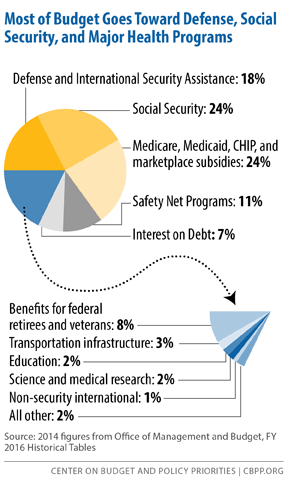
Our first chart reminds us why we pay taxes by showing where the money goes. Three large areas each account for roughly a fifth of the budget: national defense, Social Security, and health programs such as Medicare. The safety net (including programs like SNAP and unemployment insurance) plus interest on the debt make up close to another fifth.
The remaining fifth is everything else, from roads to science research, the FBI, education, veterans’ programs, and so on.
So, as we fill out our 1040 forms, we should keep in mind that part of each dollar we pay goes for a soldier’s gear, medical care for an elderly person, a smoother highway, or a promising cancer treatment.
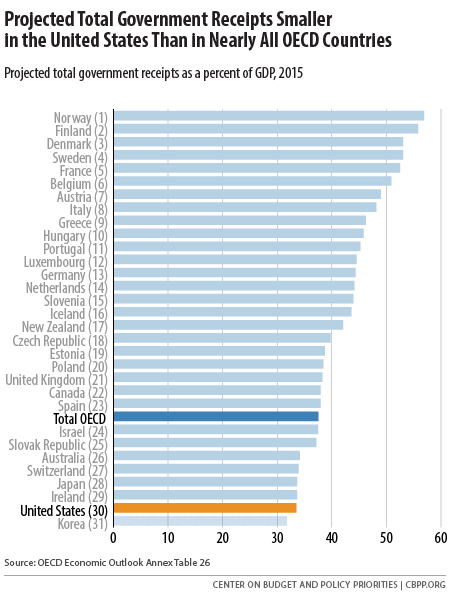
Our second chart provides some international context, showing that the United States is a very low-tax country compared to other wealthy nations. Total government receipts in the United States are not only well below other industrialized countries; they’re also lower than in countries that are far less wealthy than the United States.
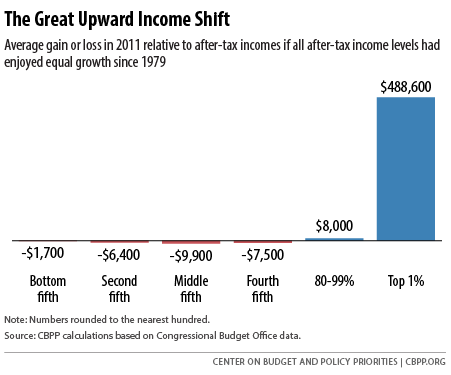
Our next two charts provide some economic context for this year’s tax debates. Beginning in the 1970s, income growth slowed sharply for middle- and lower-income people, while incomes at the top continued to grow strongly. The next chart provides a measure of this growing inequality. It shows that the average middle-income family had $9,900 less after-tax income in 2011, and the average household in the top 1 percent had $488,600 more, than if all groups’ incomes had grown at the same rate since 1979.
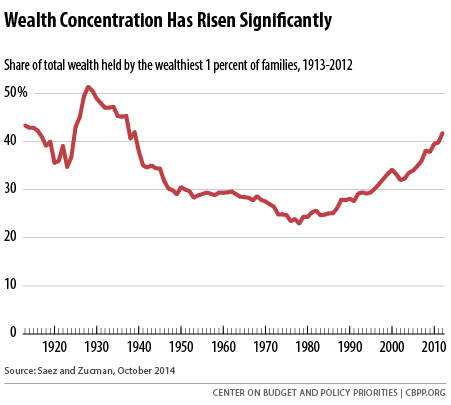
Wealth in the United States is even more concentrated than income. The wealthiest 1 percent of people hold more than 40 percent of the wealth, as our next chart shows.
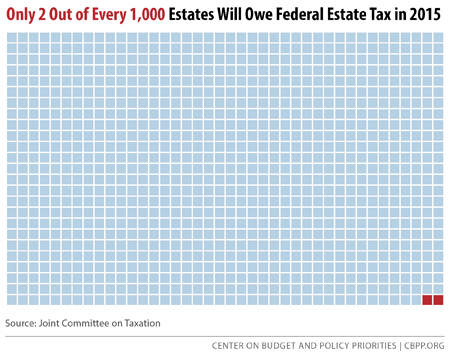
Despite these facts, House Republicans plan to vote next week to repeal the federal estate tax on inherited wealth. This would significantly worsen inequality by giving a huge tax cut to the heirs of the wealthiest estates in the country. As our next chart shows, only the estates of the wealthiest 0.2 percent of Americans — roughly 2 out of every 1,000 people who die — owe any estate tax.
A far better course would be to strengthen important tax credits that reward work and increase opportunity.
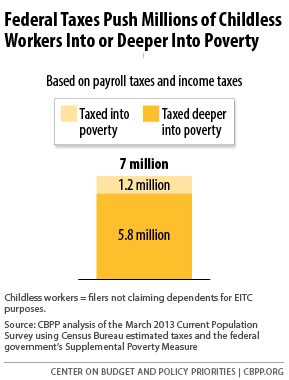
Many low-wage workers struggle to climb the economic ladder, particularly those not raising minor children. Childless workers are the sole group that the federal tax code actually taxes into (or deeper into) poverty, as our next chart shows.
Fortunately, there’s bipartisan support for proposals to address this problem. In fact, the President and House Republicans’ top tax writer, Ways and Means Chairman Paul Ryan, have nearly identical proposals to boost the Earned Income Tax Credit (EITC) for childless workers. This interactive calculator shows how those proposals would help these workers.
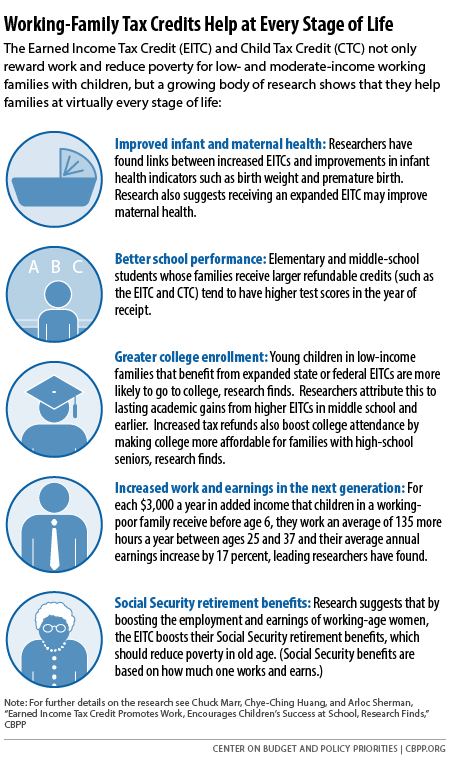
It’s also essential to make permanent key provisions of the EITC and Child Tax Credit (CTC) set to expire at the end of 2017. As our next graph shows, exciting new research shows that these working-family tax credits not only encourage and support work among parents but also help their children at virtually every stage of life.
The stakes are high for millions of families. If Congress fails to act, a single mother of two working full-time at the minimum wage — for example, caring for elderly people in a nursing home or young children in a day care center — would lose her entire $1,725 CTC in 2018. This interactive calculator shows how much working families stand to lose if Congress fails to act.
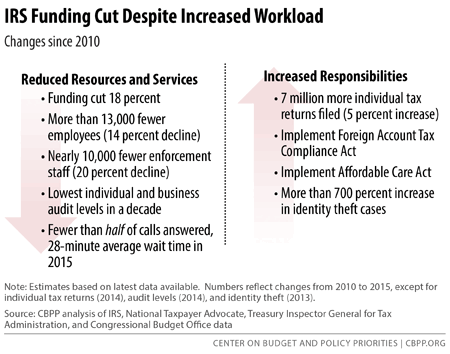
Finally, as this year’s tax filing season winds down, it’s important to note that the process for honest taxpayers has been much harder than it should be. The IRS has answered fewer than half of its calls, kept people on hold for close to a half-hour for the calls it has answered, and even then has answered only the most basic tax questions. These problems reflect several years of cuts in IRS funding, which have undermined the agency’s ability to carry out the fundamental government function of collecting revenue. If the cuts remain in place, they risk corroding the voluntary tax compliance system on which the nation relies.
