BEYOND THE NUMBERS
Tomorrow's Poverty Data Will Give Only Partial Picture
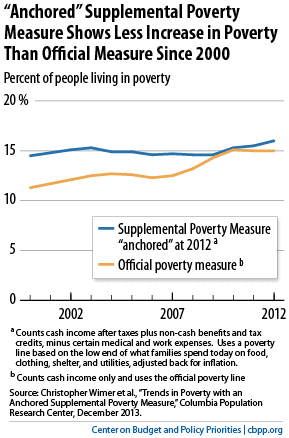
As our preview of tomorrow’s Census release of 2013 poverty data explains, the official poverty statistics are based on pre-tax cash income, so they omit support like SNAP (formerly food stamps) and rental subsidies, as well as tax-based assistance like the Earned Income Tax Credit (EITC). Later this year Census will release 2013 figures using an alternative poverty measure —the Supplemental Poverty Measure (SPM) — that includes these benefits. Columbia University researchers recently estimated a version of the SPM called the “anchored” SPM for 1967 through 2012, and this measure tells a somewhat less dreary story about poverty trends over the last decade than the official measure.
The better performance under the SPM largely reflects the powerful role of SNAP and refundable tax credits like the EITC — as strengthened by policymakers both early in the decade and through largely temporary measures in the Great Recession — which helped keep more Americans from falling into poverty as the recession deepened.
In 2013, the SPM will continue to capture policy changes left out of the official measure.
In short, tomorrow’s figures on the official poverty rate will give a real but incomplete picture of poverty and anti-poverty policies.
Our chart book on the War on Poverty has more on these issues, including