off the charts
POLICY INSIGHT
BEYOND THE NUMBERS
BEYOND THE NUMBERS
Three Charts on the Coming Budget Debate
As policymakers and the public turn their attention from the election campaign to the nation’s long-term budget challenges, here are three related CBPP reports that give some context for the coming debate:
- $2 Trillion in Deficit Savings Would Achieve Key Goal: Stabilizing the Debt Over the Next Decade. Some budget watchers are urging the President and Congress to enact $4 trillion in savings over the next ten years in order to address the deficit problem. The $4 trillion figure has assumed something of a life of its own. In fact, there is no single magic number. For example, policymakers could achieve the most essential goal — stabilizing the public debt over the coming decade (that is, ensuring that the debt doesn’t rise faster than the economy and, thus, risk eventual economic problems) — by enacting $2 trillion in savings (see first chart). This $2 trillion would be on top of the budget cuts Congress has already enacted; see the next point.
Image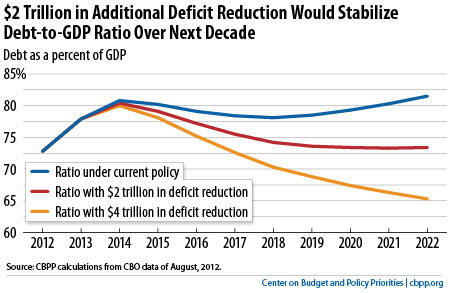
- Congress Has Cut Discretionary Funding By $1.5 Trillion Over Ten Years. Debates over how — and how much — to reduce projected deficits often overlook the fact that the first stage of large-scale deficit reduction is already in law. Legislation enacted last year, most notably the Budget Control Act, will produce $1.5 trillion in savings in discretionary (that is, non-entitlement) spending for fiscal years 2013 through 2022. These cuts will shrink non-defense discretionary funding — which includes an array of domestic programs ranging from education to law enforcement, food safety, and environmental protection, as well as international programs — to its lowest level on record as a share of GDP, with data going back to 1976 (see second chart). The enactment of these budget cuts is one reason that an additional $2 trillion in deficit reduction, rather than some bigger number, would be sufficient to stabilize the debt ratio. (See the bullet above.)
Image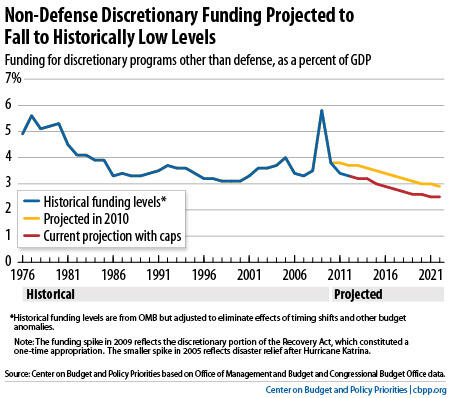
Update, November 9: we’ve updated this graph as explained here.
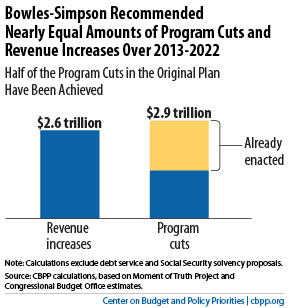
- What Was Actually in Bowles-Simpson — and How Can We Compare it With Other Plans? While many policymakers have expressed support for the budget plan that Erskine Bowles and Alan Simpson issued in December 2010, a number of policymakers and opinion leaders do not understand what the plan actually included.When looked at over fiscal years 2013-2022, the period covered by current budget plans, Bowles-Simpson called for $6.3 trillion in deficit reduction: $5.5 trillion in policy savings and about $800 billion in interest savings. The policy savings consist of 53 percent program cuts (totaling $2.9 trillion) and 47 percent revenue increases (totaling $2.6 trillion), or almost a 1-to-1 ratio (see third chart).Policymakers have already enacted about half of Bowles-Simpson’s program cuts, as we discussed in the second point, above. Thus, most of the plan’s not-yet-achieved savings are on the revenue side. Excluding the enacted savings, Bowles-Simpson would achieve an additional $4.6 trillion in deficit reduction over ten years, consisting of $1 in program cuts for every $2 in revenue increases. This $4.6 trillion in additional deficit reduction is more than twice what’s needed to stabilize the debt as a share of the economy; as we discussed above, $2 trillion in additional deficit reduction would be sufficient to stabilize the debt.Image
Topics:

CBPP
Receive the latest news and reports from the Center