BEYOND THE NUMBERS
The Myth of the Out-of-Control Federal Government
Are the size and reach of the federal government exploding, as some have suggested? While overall federal spending is well above its historical average as a share of the Gross Domestic Product (GDP) and is expected to remain so even after the economy recovers, our new examination of the latest Congressional Budget Office (CBO) data belies claims of a large and permanent expansion of the federal government.
Here’s what we found:
- If we continue current policies, federal expenditures outside of interest payments on the debt are projected to decline in the decade ahead as the economy recovers. In fact, these expenditures (which analysts call “primary outlays”) have already fallen from 23.9 percent of GDP in 2009 — at the bottom of the recession — to a projected 22.0 percent of GDP in the current year, 2012. They are projected to fall further, to 20 percent of GDP or lower in the latter part of this decade.
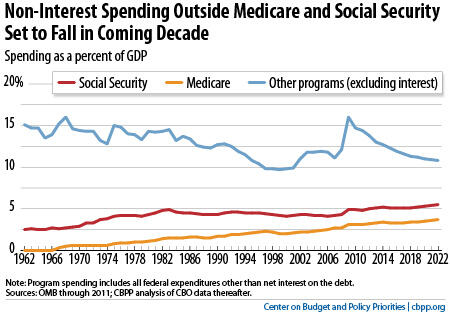
- Total non-interest spending outside of Social Security and Medicare — two programs whose costs are being driven up by the aging of the population and the rise in health care costs throughout the U.S. health care system — will fall well below its 50-year historical average in the decade ahead (see graph). By 2022 it will fall to 10.8 percent of GDP, compared to an average over the 1962-2011 period of 13.0 percent (see table).
As we conclude:
To be sure, in subsequent decades, as the population continues to age and health care costs continue to rise, federal non-interest spending will climb significantly higher. One key factor is that average health care costs are considerably greater for people in their 80s and 90s than for people in their late 60s and early 70s, and the baby boomers will become very old in future decades. In addition, if the debt continues to rise faster than GDP, interest costs will continue to swell. We will have to tackle these issues.
| Program Spending as a Share of GDP Under Continuation of Current Policies | ||||
| Avg 1962-2011 | 2012 | 2017 | 2022 | |
| Primary outlays | 18.5% | 22.0% | 20.0% | 20.0% |
| Less Social Security | 14.5% | 17.1% | 14.9% | 14.5% |
| Less Social Security and Medicare | 13.0% | 13.8% | 11.6% | 10.8% |
| Note: program spending includes all federal expenditures other than net interest on the debt. Sources: OMB through 2011; CBPP analysis of CBO data thereafter. | ||||
But when Americans hear talk of the government exploding in size and reach, they don’t usually think this means that more people will receive Social Security and Medicare because the population is growing older or that Medicare will cost more because of factors like the aging of the baby boomers and advances in medical technology that improve health and prolong life but at significant cost.
Outside of those demographic and health cost factors, the portrait of a rapidly growing federal behemoth is simply at odds with reality, since costs are shrinking to levels well below their historical averages.
