BEYOND THE NUMBERS
New Data Provide Sobering Look at Concentrated Poverty in Schools
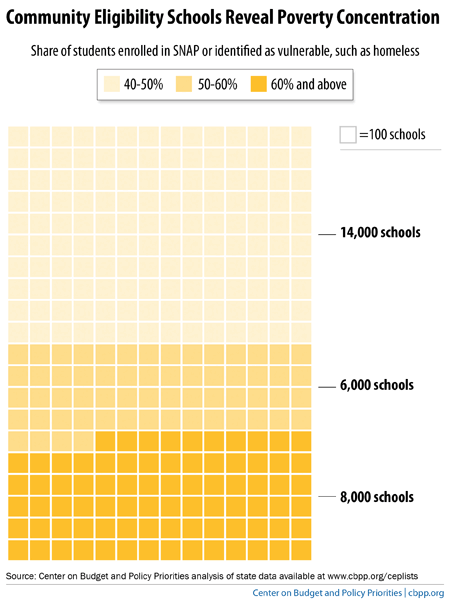
Update, June 20: We’ve updated the graph, below, to correct an error in the display of data.
New data never before systematically collected and reported show that thousands of schools across the country have very high concentrations of poor students. States provided the data as part of the new
provision of the school lunch and breakfast programs, which allows schools serving high-poverty areas to simplify their school meal programs and serve meals at no charge to all students. The data show how important community eligibility is.To implement community eligibility, states are required to publish data on which schools and districts are eligible — namely, ones in which 40 percent or more of students already qualify for free meals automatically because they either have been identified as low income by another program (such as SNAP, formerly food stamps) or are considered at risk of hunger (because they are homeless, for example). These students are called “Identified Students.”
As we’ve reported, more than one in five schools and districts nationwide — more than 28,000 schools and more than 3,000 districts — meet those criteria. Digging deeper in the new data, we’ve now found that those 28,000 schools include more than 8,000 schools in which 60 percent or more of students are Identified Students, plus another nearly 6,000 schools in which between 50 and 60 percent of students are Identified Students, in the 44 states for which we have the percentage of Identified Students for each school (see chart).
This means that in more than 14,000 schools, a majority of the students receive SNAP or are homeless, migrant, or otherwise vulnerable. That’s more than one in ten schools nationwide.
These numbers understate the number of needy children. On average, for every ten Identified Students, roughly six more students come from families that qualify for free or reduced-price school meals if they complete a school meals application.
The story for school districts is equally striking, showing concentrated poverty across broader areas. The roughly 3,000 districts that qualify for community eligibility district-wide in the states for which we have data include more than 800 districts in which 60 percent or more of students are Identified Students, plus another nearly 700 districts in which 50 to 60 percent of students are Identified Students.
To be sure, we’ve long known that many localities, ranging from large cities to rural areas, have areas of concentrated poverty. Still, the new data are sobering.
Many of these families struggle to provide enough healthy food for their children. Hungry or undernourished children have a harder time succeeding in school.
Schools with large shares of students facing deprivation confront tough challenges. Community eligibility can help them meet these challenges by ensuring that all students receive the healthy meals they need to grow, learn, and thrive.