BEYOND THE NUMBERS
New Chart Book Paints Picture of Disability Insurance
The Senate Finance Committee will hold a hearing this Thursday on Social Security Disability Insurance (DI). We’ve just released a new chart book about DI. Its more than 20 figures illustrate the essential facts and dispel some common misperceptions about this vitally important program.
For example, the following graph shows how growth in DI’s benefit rolls has slowed sharply.
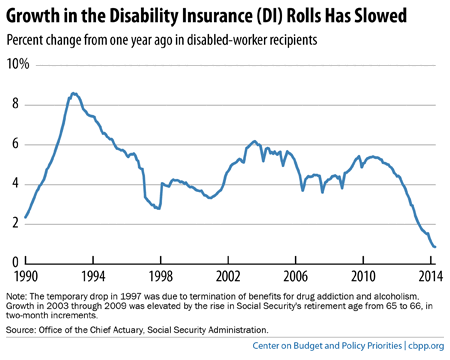
The growth in the number of DI beneficiaries in recent decades stems largely from well-known demographic factors. These include the growth of the population; the aging of the baby boomers into their 50s and 60s, which are years of peak risk for disability; growth in women’s labor force participation, which makes women much more likely to earn insured status for DI; and the rise in Social Security’s full retirement age from 65 to 66.
Both demographic and economic pressures on DI are easing. In recent months, growth in the number of DI beneficiaries has slowed to its lowest rate in 25 years. Social Security’s actuaries project that the program’s costs will level off as the economy continues to mend and baby boomers move from the disability rolls to the retirement rolls.
DI costs are projected to exceed revenues, however, and the program’s trust fund needs to be replenished in 2016. Unless Congress increases the share of the Social Security payroll tax devoted to DI, beneficiaries would then face a 20 percent cut in benefits.
Reallocation between the DI trust fund and Social Security’s much larger Old-Age and Survivors Insurance (OASI) fund is a traditional method of addressing shortfalls in one program, and Congress should do so to avoid a harsh and unacceptable cut in benefits for an extremely vulnerable group.
For the full chart book, click here.