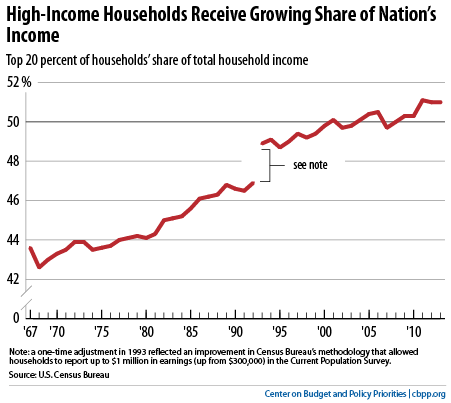
Income inequality remained near a record high in 2013 by several measures the Census Bureau released earlier this week, with data going back to 1967. The principal Census summary measure of household income inequality, known as the “Gini coefficient,” was not statistically different from the record high in 2012. And the share of national income that goes to the top fifth of households was 51.0 percent, not statistically different from its record high of 51.1 percent in 2011. The share of the nation’s income going to the top 20 percent has been growing for decades, but it only recently surpassed 50 percent. That means the top 20 percent of households receive more of the nation’s income than the bottom 80 percent combined (see chart).
The Census figures provide an
incomplete look at pre-tax income inequality — for example, they don’t include capital gains (a major income source for the affluent) and don’t ask about earnings above $1.1 million, while also leaving out key income sources for the poor such as government food assistance, rent subsidies, and tax credits. Still, the trend of high and rising inequality that the new data show is consistent with other recent studies. For example, a
recent Federal Reserve study finds evidence of growing income concentration between 2010 and 2013. “Only families at the very top of the income distribution saw widespread income gains between 2010 and 2013,” the study found, as incomes grew for the nation as a whole but fell for middle- and lower-income households. (Unlike the Census data, the Fed’s survey includes capital gains and SNAP — formerly food stamp — benefits.) Preliminary tax-return data through 2012, as analyzed by
economist Emmanuel Saez, provide further evidence about widening inequality in recent years. Saez found that from 2009 to 2012, average pre-tax income of the top 1 percent of households rose 31 percent — or by about $300,000 per household — but rose by just 0.4 percent (an average of about $170) for the other 99 percent of households. (These figures do not include government benefits and, thus, provide a picture of economic inequality before tax and transfer policies.) The top 1 percent received 95 percent of the nation’s total rise in pre-tax income during this period, Saez found.