BEYOND THE NUMBERS
Income Growth at the Top Mostly Occurring at the Tippy-Top
As our new report on the latest analysis of IRS data by economists Thomas Piketty and Emmanuel Saez shows, the share of before-tax income going to the top 1 percent of households rose in 2010 (the first full year of the recovery), after falling during the Great Recession.
What’s striking is how much of the income growth for the top 1 percent occurred at the very top.
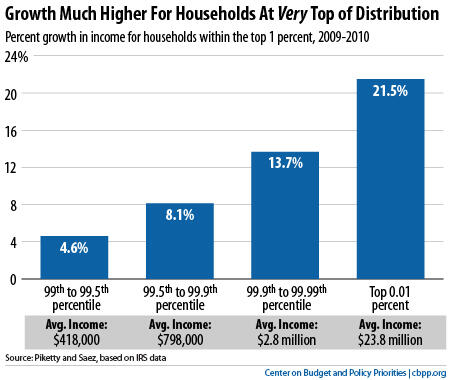
To illustrate this lopsided growth, this chart separates income groups within the top 1 percent. The top 1 percent in 2010 had incomes above $350,000 and, as a group, enjoyed average income growth of nearly 12 percent from 2009 to 2010.
However, growth for households in the “bottom half” of the top 1 percent — the non-millionaires — was significantly smaller than growth for the multimillionaires at the very top.
Though the bottom half of the top 1 percent could not compete with the multimillionaires when it comes to income growth, we should note that they still did much better than the bottom 90 percent of households in America, whose income failed to grow at all in 2010. (For reasons discussed in our guide to statistics on income inequality, Congressional Budget Office data provide a better guide to income growth and its distribution in the bottom 90 percent than the Piketty-Saez data, but they are only available through 2007.)
As we have shown, the uneven distribution of economic gains in recent years continues a longer-term trend that began in the late 1970s. In the generation following World War II, robust economic gains were shared widely, but in recent decades, income growth at the top has rapidly outpaced the rest of the distribution.
It remains to be seen whether this trend will continue in the wake of the Great Recession, but these new data for 2010 hint that it may.