BEYOND THE NUMBERS
Even in a Down Year, Top 1% Had More Total Income than Bottom 50%
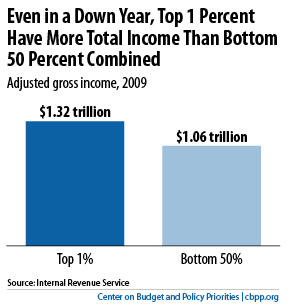
The total adjusted gross income (AGI) of the top 1 percent of households in 2009 was 25 percent greater than the total AGI of the bottom 50 percent of households, new IRS data show (see graph). That’s particularly striking given that 2009 was a “down” year for high-income people.
As my colleague Chad Stone noted yesterday, the incomes of the top 1 percent fell disproportionately during the recent financial crisis but bounced back smartly in 2010.
At the height of the previous expansion, in 2007, the top 1 percent had 87 percent more total AGI than the bottom 50 percent. But even the 2009 gap of “only” 25 percent — the difference between the $1.32 trillion earned by the top 1 percent and the $1.06 trillion earned by the bottom 50 percent — is pretty staggering.
