Enough Is Enough on Tax Cuts for Wealthy
http://www.offthechartsblog.org/enough-is-enough-on-tax-cuts-for-wealthy/
Posted by: Chuck Marr
Posted in: 2001/2003 Tax Cuts, Deficits and Projections, Federal Budget, Federal Tax, Individuals and Families, Taxes and the Economy
UPDATE, SEPTEMBER 30: We’ve revised some of the figures in this post. Click here for the updated numbers.
In yesterday’s New York Times, Richard Thaler, one of the nation’s top economists, neatly refuted the arguments for borrowing tens of billions of dollars each year to keep President Bush’s tax cuts flowing to the most affluent 2 percent of people in the country. He then posed a central question: “whether we want a society in which the rich take an ever-increasing share of the pie, or prefer to return to conditions that allow all classes to anticipate an increasing standard of living.”
As I’ve noted before, over the last three decades a stunning shift in income has taken place in this country, from the middle class to those few at the very top of the income scale. Back in 1979, the middle 20 percent of Americans had more than twice as large a share of the nation’s total after-tax income as the top 1 percent. But by 2007, the top 1 percent’s slice of the economic pie had more than doubled and in fact exceeded the middle class’s slice, which had shrunk.
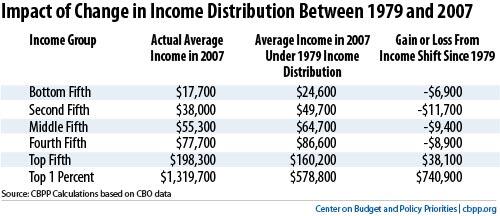
This great income shift means the average middle-income American family had about $9,000 less after-tax income in 2007, and an average household in the top 1 percent had $741,000 more, than they would have had if the 1979 income distribution had remained. Here’s how this looks in graph and table form:


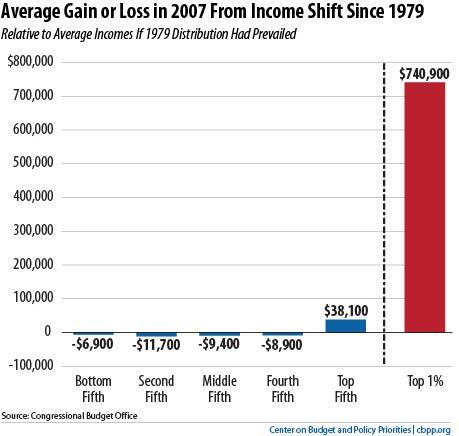
Fully two-thirds of the income gains in the last economic expansion (2001-2007) flowed to just the top 1 percent. This is not a healthy sign for a society. As Professor Thaler urges, we need to decide whether we want to promote still-greater inequality (by extending the high-income tax cuts) or lean against this trend. Each year the average millionaire gets about $125,000 from the Bush tax cuts, according to the Urban-Brookings Tax Policy Center. Now seems to be a good time to say enough is enough.


Dan, we’re not talking about imposing new taxes, we are talking about allowing the temporary Bush tax reduction to expire on its allotted date, thus returning the super-rich to their prior tax status. I’ve heard none of the affected class complain, and several state that they do not need the cuts.
Bush predicated the cuts on the premise that they would result in trickle-down economic stimulus. He was wrong. Very wrong. The super rich do not use their own money for business purposes. They got rich using Other People’s Money. The really super-rich don’t even notice – past a certain level their wealth just grows faster than they can spend it anyway. All they do with the reduction is grow their wealth more by not spending any differently. So instead the effect was to reduce the lower bracket’s disposable income because the tax cuts had to be compensated for, and the GOP philosophy there is to cut benefits for the poor. Which resulted in a vicious downwards spiral in the economy.
If you torture the numbers long enough, they will confess to anything!
This is ridiculous and misleading. Who cares what the “average income under the 1979 distribution” was? All the chart really shows is that the lower fifths of the tax base are increasing at a slower rate than the upper fifths, not that the lower fifths have suffered a reduction in income or buying power.
Thank you for the comment. For a number of decades following World War II, national income growth was shared widely. When income growth stopped being so widely shared, income growth in the middle and bottom slowed as a result. The chart simply illustrates the trend of unequal growth among different income groups over the past three decades.
In fact, incomes at the bottom and middle of the income scale have stagnated, while incomes at the top have soared, as this chart illustrates: http://www.cbpp.org/images/cms//6-25-10inc-f1.jpg.
Yes, we would all prefer a more uniform growth in income across the board, but an artificial slowing of the top-rate income growth through the imposition of an additional tax does not address the problem of low income growth at the lower levels unless one believes that aggregate income is fixed.
It saddens me too see this infallible, senseless and indifferent, money breed.
After a wealth of experience on both sides of the block, I am aware of the glaring lies that are spun. Moreover, It saddens me to see so many hateful
and drone like Americans fall victim to the infallible fact of a 2% get it all in America.
I would love to see a more detailed analysis of that top 1%, as that is where all the S corporation owners are if I am not mistaken.
That’s an excellent question. The CBO data we used does include a breakdown of income sources, including for the top 1%, which you can find here (http://www.cbo.gov/publications/collections/tax/2010/income_by_source.pdf), though S-Corp income is included in the broader category of “other business income.”
Hi, Chuck. Very interesting indeed. Can you give a link to the source data for this? I’m having trouble finding it and would like to look at it more myself.
Greg, here is the link: http://www.cbo.gov/publications/collections/collections.cfm?collect=13