BEYOND THE NUMBERS
A Layered Look at State Spending Under TANF
In a new paper, we’ve studied how states have used their federal and state funds under the Temporary Assistance to Needy Families (TANF) program since it — and its structure as a block grant — replaced Aid to Families with Dependent Children in 1996.
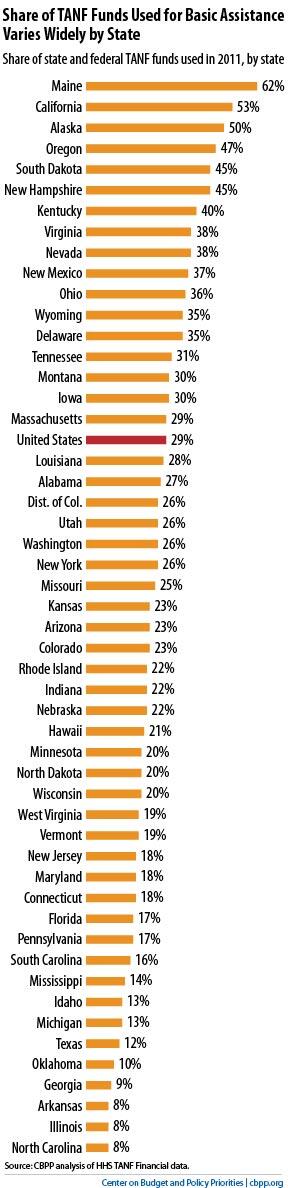
That analysis revealed some troubling national trends, as I explained yesterday. It’s important to remember, though, that states vary widely beneath those national, top-line numbers. For example, national spending on basic assistance fell from 70 percent of combined federal and state TANF funds at TANF’s start to only about 29 percent in 2011. But a state-by-state look shows that there’s more than a 50-point difference separating the states that spent the greatest and least shares of their state and federal TANF funds on basic assistance in 2011. Nine states spent less than 15 percent, while seven others spent 40 percent or more (see chart).
We’ve prepared individual fact sheets for each state and the District of Columbia as well as an overall fact sheet on total U.S. spending trends to explain these variations in greater detail. Each sheet includes:
- The amount of the state’s 2011 federal TANF allocation and own spending obligation;
- State-specific trends in spending between 1997 and 2011, including shifts in how the state has used its state and federal TANF funds over time; and
- Detailed comparison of a state’s TANF spending in five key areas between 2011 and a decade earlier.
Click here to access the fact sheets. Interested readers can also download a spreadsheet with detailed, annual state-by-state data here.