off the charts
POLICY INSIGHT
BEYOND THE NUMBERS
BEYOND THE NUMBERS
5 Facts to Help You Understand Next Week’s Poverty Figures
Our new report provides context for the official poverty and income figures for 2013, which the Census Bureau will release on Tuesday. Here are the highlights:
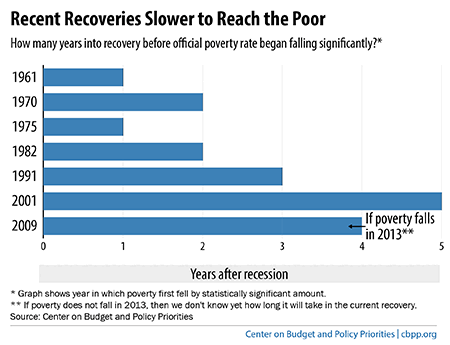
- As in other recent recoveries, poverty has been slow to decline. Over time, poverty rates tend to move roughly in tandem with economic indicators, which generally improved slightly in 2013. Thus, the poverty rate — which jumped from 12.5 percent in 2007 to 15.1 percent in 2010 and remained essentially unchanged at 15.0 percent in 2011 and 2012 — may start to improve in 2013 as well, although the improvement might not be statistically significant.A return to pre-recession poverty levels is unlikely soon. To replace the millions of jobs lost in the Great Recession anytime soon and keep up with population growth, the economy must create jobs faster than it has to date. Although the economic recovery (which officially began in June 2009) is not uniquely disappointing in this regard, it is still problematic — and because the economic downturn was so deep, there is much more ground to make up. Recoveries in the 1960s, 1970s, and 1980s featured quicker reductions in poverty (see graph).Image
- Austerity policies likely hampered progress against poverty in 2013. The economy almost certainly would have improved more in 2013 had austerity policies not reduced the government’s contribution to the economy. These included the “sequestration” spending cuts of the 2011 Budget Control Act and first implemented in 2013 and the expiration of the payroll tax holiday, which reduced most workers’ take-home pay by 2 percent of earnings.
- Unequal wage growth also slowed progress. Between 2009 and 2013, inflation-adjusted hourly wages rose by 1 percent for workers at the 95th percentile (workers whose wage levels exceed those of 95 percent of all workers but are less than the remaining 5 percent), but fell by about 4 to 6 percent for workers in the bottom 60 percent of the wage scale, according to the Economic Policy Institute.
- Income inequality tied a record-high level in 2012. The income gap between rich and poor as measured by the Gini index — the Census Bureau’s main summary indicator of inequality in pre-tax cash income — tied a record in 2012, with the data going back to 1967. Other inequality measures also stood at or near record levels in 2012.
- Most poverty figures released on Tuesday won’t reflect non-cash benefits. The Census figures will focus on the official poverty statistics, which are based on pre-tax cash income and omit support such as food assistance and rental subsidies as well as tax-based assistance such as the Earned Income Tax Credit (EITC). An alternative Census Bureau poverty measure, the Supplemental Poverty Measure (SPM), includes these types of assistance, and experts generally consider it a more reliable tool for measuring changes in poverty over time as well as the safety net’s impact on poverty. Unfortunately, Census will not release SPM figures for 2013 until later this year. However, Census will release a table on Tuesday providing data on the poverty-reducing effects of certain programs, including SNAP (formerly food stamps) and the EITC.

Receive the latest news and reports from the Center