“Tax Freedom Day” Greatly Overstates Typical Household’s Taxes
http://www.offthechartsblog.org/%e2%80%9ctax-freedom-day%e2%80%9d-greatly-overstates-typical-household%e2%80%99s-taxes/
Posted by: CBPP
Posted in: Federal Tax, Individuals and Families
The Tax Foundation announced today that what it calls “Tax Freedom Day” for 2011, or the day it claims Americans will have “earned enough money to pay this year’s tax obligations at the federal, state and local levels,” will occur on April 12. We’re updating our analysis explaining the problems with this annual report, but in the meantime, here are the basics:
Many journalists and policymakers have misinterpreted the Tax Foundation’s report as reflecting the tax bills that typical middle-income workers face. But in reality, the Tax Foundation’s calculation of the “average” tax bill merely measures tax revenues as a share of the economy.
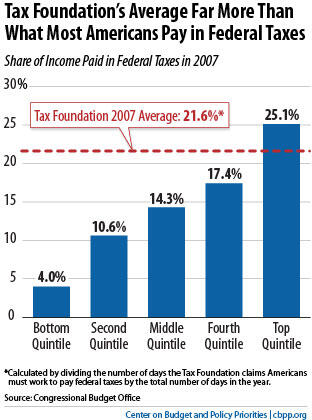
In a progressive tax system like ours, only upper-income households pay tax at rates at or above the overall level of revenues as a share of the economy. Authoritative figures from the non-partisan Congressional Budget Office show that middle- and even upper-middle-income Americans pay a considerably smaller share of their income in taxes than the Tax Foundation report implies.
In fact, CBO data for 2007 (the most recent year available) suggest that 80 percent of U.S. households pay federal tax at a lower rate than the Tax Foundation’s estimated “average” federal tax obligation (see graph).


CTJ.ORG
2008 Taxes
federal state locaL
INCOMES AND 2008 TAXES ON IT FROM FED—STATE-LOCAL
Avg Cash Income—Total Income–Total Taxes—Fed—State+Local-TOTAL
lowest 20%–$12,000————3.2%————2.0%———6.8%——11.9%—–18.7%
Second 20%-$24,000————6.7%————5.0%———11.0%—–11.2%—–22.3%
Middle 20%-$40,000————11.1%———–10.1%——–15.9%—-11.1%—–27.0%
Fourth 20%–$56,100————18.4%———–18.5%——–18.9%—-11.1%—–30.0%
Next 10%—-$101,000———–14.0%———–14.8%——–20.3%—-11.1%—–31.5%
Next 5%——$144,000———–10.1%———–10.9%——–21.4%—-10.8%—–32.2%
Next 4%——$253,000———–14.3%———–15.5%——–22.0%—-10.1%—–32.1%
Top 1%——-$1,445,000———22.2%———–23.0%——–22.7%——8.2%—–30.9%
ALL $70,400————-100.0%———100.0%——-19.4%—–10.3——-29.8%
Bottom 99%-$56,500—————77.9%———–76.8%——18.4%—–10.9%—–29.4%
Taxes include all federal, state and local
(personal & corporate income, property, sales,excise. estate etc)
For calculations of income shares and taxes as % of income, income includes employer -paid FICA taxes and corporate profit net of taxable dividends, neither of which is included in the average cash income figures shown
source-Institute on Taxation and Economic Policy Tax Model April 2009
Citizens For Tax Justice April 2009
Bob Mcintyre 202-299-2066 X 22
According to various sites found on Google the total tax burden of ALL US taxes (federal, state, local) is about 24% of gross national income. Only Japan of all developed nations pays at a lower rate. USA is a low tax nation, especially when compared with Scandinavia. Look it up.
They don’t pay taxes in Somalia, Southern Sudan, Afghanistan, etc. Don’t like our taxes? Move to one of these tax shelters.
And does this take into consideration Social Security, Medicare, etc? Most of us pay more for those, particularly when the employer portion is considered, as it must be.
And then they ought to talk about state taxes — and not just income taxes, but all the other indirect taxes we pay.
We’d be better off if we shifted from indirect taxes to direct taxes. Henry George and his followers (and precursors, too) told us what we ought to be taxing, and special interests weren’t keen on it. Explore wealthandwant or lvtfan for more on the topic. There is a much better alternative than the income tax.
Basically, Tax Freedom Day was measured by dividing total tax revenues, as determined by the BEA, by Net National Product and multiplying that ratio by 365 to get the number of days an “average” household had to work to pay taxes, and for other consumption items. It was not designed to indicate any particular household. Total taxes included, corporate income taxes, property taxes (residentaila nad non-residential, excise taxes, sales taxes, personal income taxes, social insurance taxes,and all other taxes. NNP was used as a measure of total household income. Tax Freedom Day was a short hand way of presenting how much of each year’s net output went to taxes — federal, state, and local. If CBPP wishes to estimate “Tax Freedom Day” by income bracket or other measure, you could estimate NNP by income group and making assumptions regarding the incidence of business taxes by income group CBPP could create its own Tax Freedom Day.